

Question: omework (Ch 14) 3. Profit maximization using total cost and total revenue curves Suppose Iyana operates a handicraft pop-up retail shop that sells phone cases.

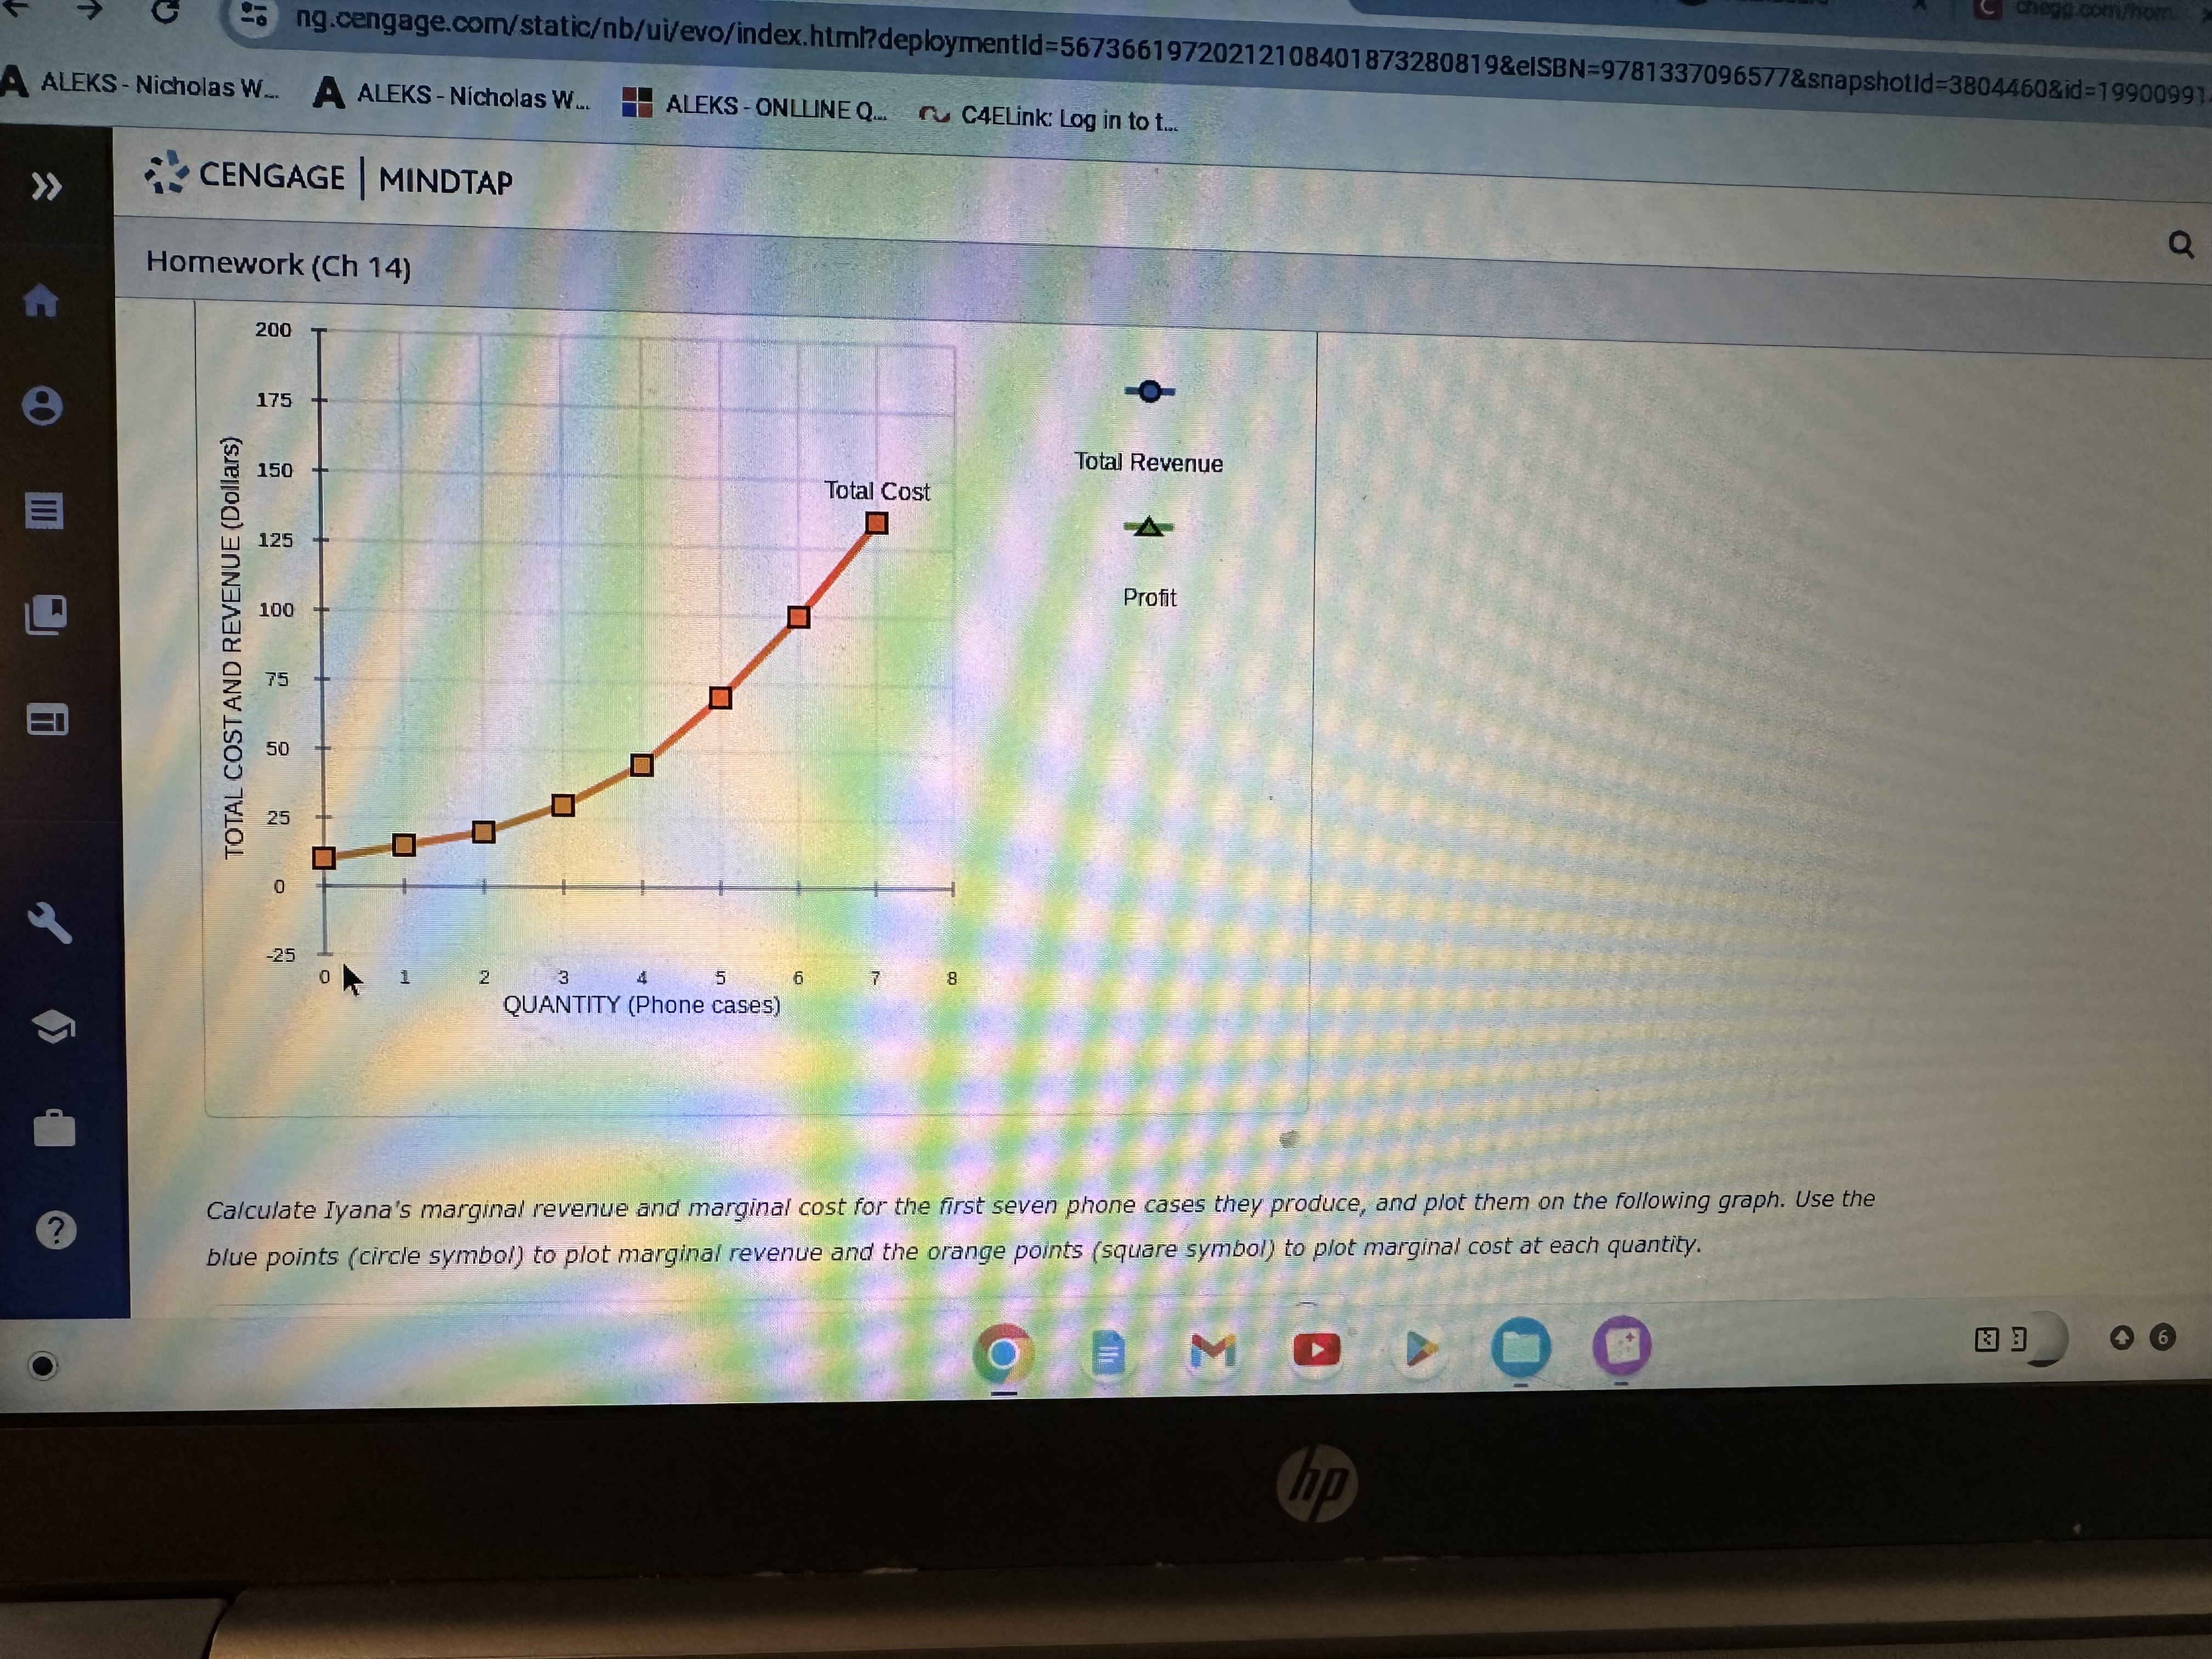


omework (Ch 14) 3. Profit maximization using total cost and total revenue curves Suppose Iyana operates a handicraft pop-up retail shop that sells phone cases. Assume a perfectly competitive market structure for phone cases with a market price equal to $20 per phone case. The following graph shows Iyana's total cost curve. Use the blue points (circle symbol) to plot total revenue and the green points (triangle symbol) to plot profit for phone cases for quantities zero through seven (including zero and seven) that Iyana produces. 200 O 175 Total Revenue 150 Total Cost A 125 AND REVENUE (Dollars) Profit 100 75 O O hp- ng.cengage.com/staticb/ui/evo/index.html?deploymentld=56736619720212108401873280819&eISBN=9781337096577&snapshotld=3804460&id=1990099 A ALEKS - Nicholas W. A ALEKS- Nicholas W. ALEKS-ONLINE Q. ~ C4ELink: Log in to t. > > CENGAGE | MINDTAP Q Homework (Ch 14) 200 175 Total Revenue 150 Total Cost 125 Profit 100 TOTAL COST AND REVENUE (Dollars) 75 EI 50 25 O 3 5 QUANTITY (Phone cases) Calculate Iyana's marginal revenue and marginal cost for the first seven phone cases they produce, and plot them on the following graph. Use the ? blue points ( circle symbol) to plot marginal revenue and the orange points (square symbol) to plot marginal cost at each quantity. Oare Mind Top - Cangal X C ng. cengage.com/static/itb/ ul/evo/index.humideploymentld=58736619720212108401873280819&ISBN-978133709657/&snapshold=3804460&ld=199009914. S - Nicholas W. A ALEKS - Nicholas W.. ALEKS -ONLINE Q.. ~ CAELink: Log in to t.. CENGAGE | MINDTAP Q Search Homework (Ch 14) Calculate Iyana's marginal revenue and marginal cost for the first seven phone cases they produce, and plot them on the following graph. Use the blue points (circle symbol) to plot marginal revenue and the orange points (square symbol) to plot marginal cost at each quantity. 40 35 Marginal Revenue 30 25 Marginal Cost 20 COSTS AND REVENUE (Dollars per phone case) 15 10 1 2 3 5 QUANTITY (Phone cases) E E hpQUANTITY (Phone cases) Iyana's profit is maximized when they produce a total of phone cases. At this quantity, the marginal cost of the final phone cas: is|$ , an amount W than the price received for each phone case they sell. At this point, the marginal cost of pmdh&ing phone case (the first phone case beyond the profit maximizing quantity) is | $ , an amount W than the price receive - case they sell. Therefore, Iyana's profit-maximizing quantity occurs at the point of intersection between the W curves. Because Iyana is a price taker, the previous condition is equivalentto w . & Grade lt Now Save & Continue | Continue withol
Step by Step Solution
There are 3 Steps involved in it

Get step-by-step solutions from verified subject matter experts