

Question: On a sheet of graph paper, plot the points ( x , y ) in your chart. You should see a smooth curve, otherwise something
On a sheet of graph paper, plot the points in your chart. You should see a smooth curve, otherwise something is off.
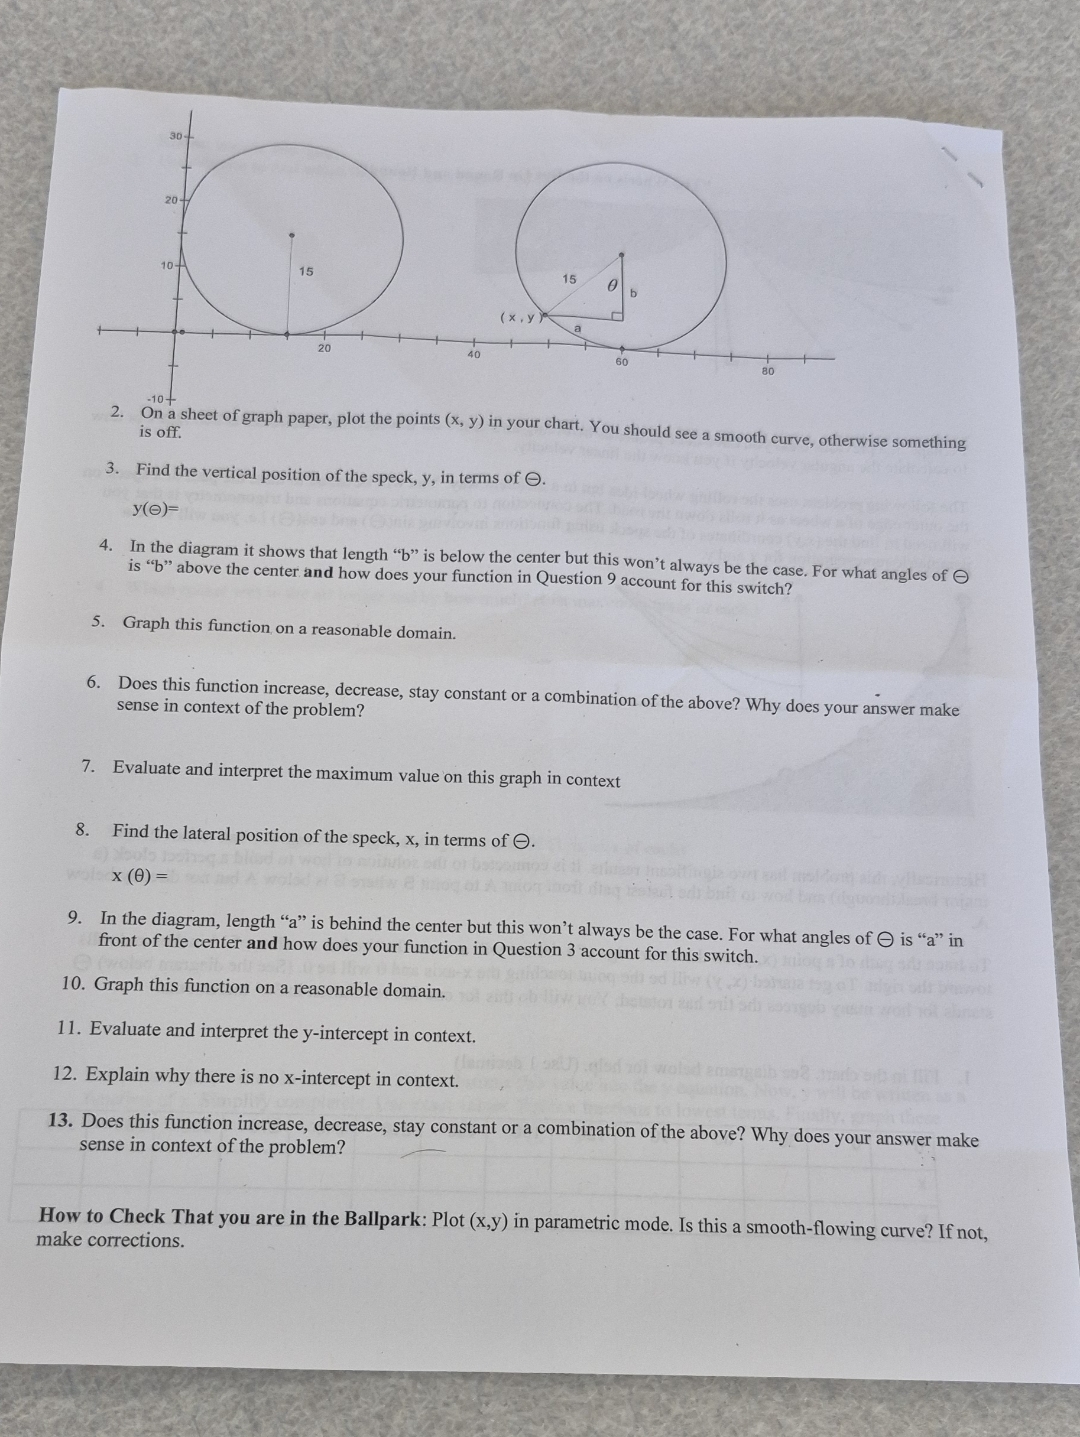
Find the vertical position of the speck, in terms of
In the diagram it shows that length is below the center but this won't always be the case. For what angles of is b above the center and how does your function in Question account for this switch?
Graph this function on a reasonable domain.
Does this function increase, decrease, stay constant or a combination of the above? Why does your answer make sense in context of the problem?
Evaluate and interpret the maximum value on this graph in context
Find the lateral position of the speck, x in terms of
In the diagram, length a is behind the center but this won't always be the case. For what angles of is in front of the center and how does your function in Question account for this switch.
Graph this function on a reasonable domain.
Evaluate and interpret the intercept in context.
Explain why there is no xintercept in context.
Does this function increase, decrease, stay constant or a combination of the above? Why does your answer make sense in context of the problem?
How to Check That you are in the Ballpark: Plot in parametric mode. Is this a smoothflowing curve? If not, make corrections.
Step by Step Solution
There are 3 Steps involved in it
1 Expert Approved Answer
Step: 1 Unlock

Question Has Been Solved by an Expert!
Get step-by-step solutions from verified subject matter experts
Step: 2 Unlock
Step: 3 Unlock