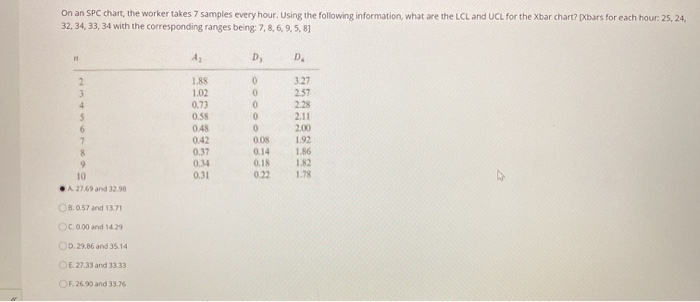
Question: On an SPC chart, the worker takes 7 samples every hour. Using the following information, what are the LCL and UCL for the Xbar chart?

On an SPC chart, the worker takes 7 samples every
On an SPC chart, the worker takes 7 samples every hour. Using the following information, what are the LCL and UCL for the Xbar chart? [Xbars for each hour: 25, 24. 32, 34, 33, 34 with the corresponding ranges being 7, 8, 6, 9,5, 8] D 3.27 0 2.11 1.RS 1.02 0.73 0.58 0.48 0.42 0.37 0.34 0.31 0.08 0.14 0.18 0.22 A 27.69 and 320 8.0 57 and 13.71 OC.000 and 149 OD 29.86 and 35.14 E 27.33 and 33 33 5.26.90 and 33.76

Step by Step Solution

There are 3 Steps involved in it

1 Expert Approved Answer
Step: 1 Unlock blur-text-image
Question Has Been Solved by an Expert!

Get step-by-step solutions from verified subject matter experts

Step: 2 Unlock
Step: 3 Unlock

Students Have Also Explored These Related General Management Questions!