

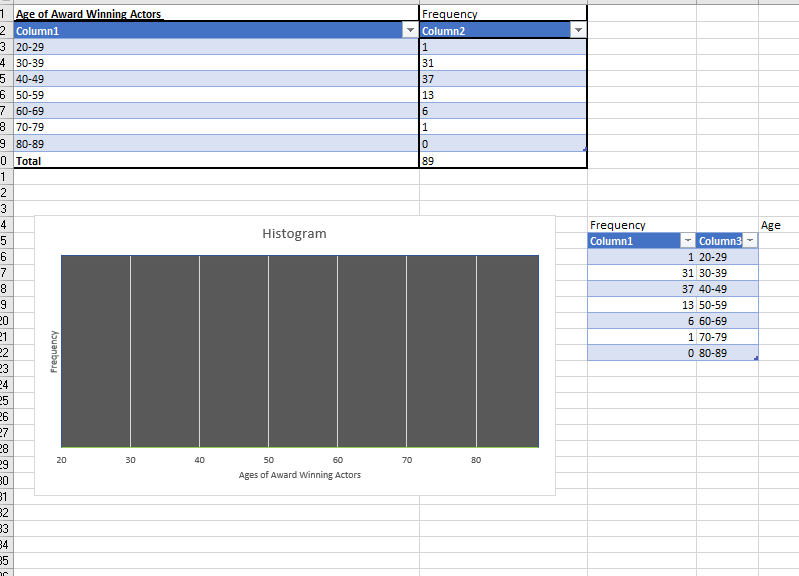
Question: On Excel, when I am using a histogram to input data to make a chart, how do I make a histogram? I have the histogram
On Excel, when I am using a histogram to input data to make a chart, how do I make a histogram? I have the histogram template but I don't know what functions to use to actually separate the bars and make the heights different. And on the horizontal axis, I am having a hard time putting the specific data there because it won't let me input anything except one number. This is what it looks like lol.. and I have an example of what its supposed to look like but I cant get it. Also on the vertical access it's supposed to be 0-40 and I was able to do it one time but as I kept messing with it, i lost it and I can't remember how to place the numbers on the horizontal access either.
\f
Step by Step Solution
There are 3 Steps involved in it

Get step-by-step solutions from verified subject matter experts