Question: On January 28th, 1986, the space shuttle Challenger exploded less than two minutes after it launched, killing all seven crewmembers while about 17% of Americans
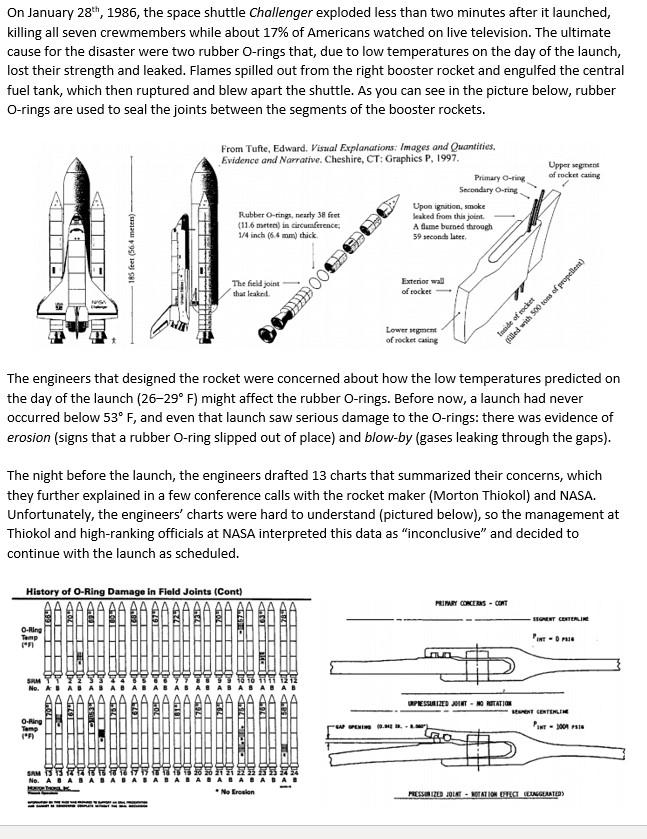
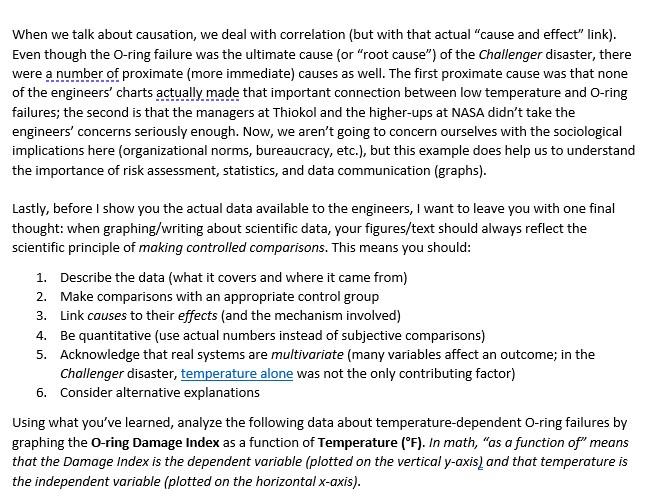
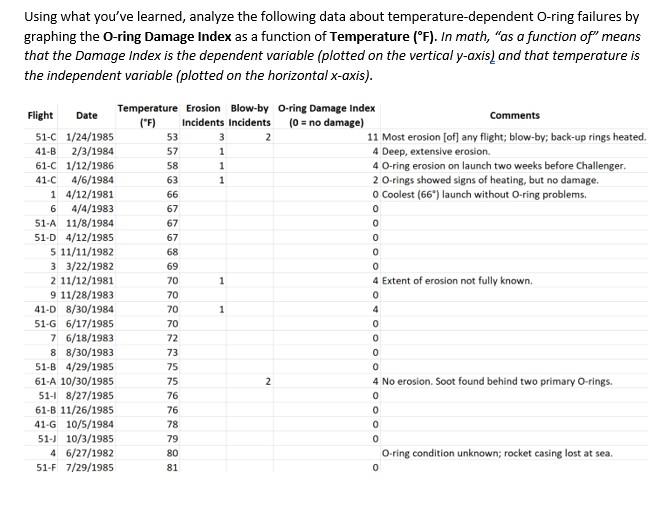
On January 28th, 1986, the space shuttle Challenger exploded less than two minutes after it launched, killing all seven crewmembers while about 17% of Americans watched on live television. The ultimate cause for the disaster were two rubber O-rings that, due to low temperatures on the day of the launch, lost their strength and leaked. Flames spilled out from the right booster rocket and engulfed the central fuel tank, which then ruptured and blew apart the shuttle. As you can see in the picture below, rubber O-rings are used to seal the joints between the segments of the booster rockets. Upper g of rocket caning From Tufte, Edward. Visual Explanations: Images and Quantities. Evidence and Narrative. Cheshire, CT: Graphics P. 1997, Primary O- Secondary O-ring Upon igration, smoke Rubber O-rings, nearly 38 fret Leaked from this joint (11.6 m) in circumference, A dume burned through 1/4 inch (6.4 mm thick 59 seconds later CI 185 feet (564 meters) IRELE 4000 The field joint thar lakrit. Exterior wall of rocker 77 Inode of rocket (rapadnad je u op Lower nem of rocket casing The engineers that designed the rocket were concerned about how the low temperatures predicted on the day of the launch (26-29 F) might affect the rubber O-rings. Before now, a launch had never occurred below 53 F, and even that launch saw serious damage to the O-rings: there was evidence of erosion (signs that a rubber O-ring slipped out of place) and blow-by (gases leaking through the gaps). The night before the launch, the engineers drafted 13 charts that summarized their concerns, which they further explained in a few conference calls with the rocket maker (Morton Thiokol) and NASA. Unfortunately, the engineers' charts were hard to understand (pictured below), so the management at Thiokol and high-ranking officials at NASA interpreted this data as "inconclusive" and decided to continue with the launch as scheduled. History of O-Ring Damage In Field Joints (Cont) POWRY CORES - CONT SONT CENTELIKE O-Ring Temp 1991 IL TROLDDD lche LIN 29DID -- ODIN ODIDIE IDIR DD17DDDD > DICIDULTOULD OILLE TOTO OTTOTITI CELOTITIE a. Die C291 To HOLThes OD ODDI nec ID OLI 172D> Hotels 178D DI17 CHAD CH221 D119 . TUTTI HOZ TUDI TE DIIDITUR CODE 1924 OTTIDDITUR TON IN On F- DROIDLA DDDDDDD SPRESSURIZED HI-WRITATO BENT CENTELING PINI O-Ring Yang 1F) SEM . SAM No. A PE No Erosion PESIELD JOUE - NATION DETECT LINGUAATED) When we talk about causation, we deal with correlation (but with that actual "cause and effect" link). Even though the O-ring failure was the ultimate cause (or "root cause") of the Challenger disaster, there were a number of proximate (more immediate) causes as well. The first proximate cause was that none of the engineers' charts actually made that important connection between low temperature and O-ring failures; the second is that the managers at Thiokol and the higher-ups at NASA didn't take the engineers' concerns seriously enough. Now, we aren't going to concern ourselves with the sociological implications here (organizational norms, bureaucracy, etc.), but this example does help us to understand the importance of risk assessment, statistics, and data communication (graphs). 4. Lastly, before I show you the actual data available to the engineers, I want to leave you with one final thought: when graphing/writing about scientific data, your figures/text should always reflect the scientific principle of making controlled comparisons. This means you should: 1. Describe the data (what it covers and where it came from) 2. Make comparisons with an appropriate control group 3. Link causes to their effects and the mechanism involved) Be quantitative (use actual numbers instead of subjective comparisons) 5. Acknowledge that real systems are multivariate (many variables affect an outcome; in the Challenger disaster, temperature alone was not the only contributing factor) 6. Consider alternative explanations Using what you've learned, analyze the following data about temperature-dependent O-ring failures by graphing the O-ring Damage Index as a function of Temperature (F). In math, "as a function of" means that the Damage Index is the dependent variable (plotted on the vertical y-axis, and that temperature is the independent variable (plotted on the horizontal x-axis). Using what you've learned, analyze the following data about temperature-dependent O-ring failures by graphing the O-ring Damage Index as a function of Temperature (F). In math, "as a function of" means that the Damage Index is the dependent variable (plotted on the vertical y-axis) and that temperature is the independent variable (plotted on the horizontal x-axis). 67 67 0 0 0 68 0 Flight Date Temperature Erosion Blow-by O-ring Damage Index (F) Incidents Incidents (0 = no damage) Comments 51-C 1/24/1985 53 3 11 Most erosion [of] any flight; blow-by; back-up rings heated. 41-B 2/3/1984 57 1 4 Deep, extensive erosion. 61-C 1/12/1986 58 1 4 O-ring erosion on launch two weeks before Challenger. 41-C 4/6/1984 63 1 2 O-rings showed signs of heating, but no damage. 1 4/12/1981 66 O Coolest (66*) launch without O-ring problems, 6 4/4/1983 51-A 11/8/1984 51-D 4/12/1985 67 5 11/11/1982 3 3/22/1982 69 0 2 11/12/1981 70 1 4 Extent of erosion not fully known 9 11/28/1983 70 0 41-D 8/30/1984 70 1 51-G 6/17/1985 70 0 7 6/18/1983 72 0 8 8/30/1983 73 0 51-B 4/29/1985 75 61-A 10/30/1985 75 2 4 No erosion. Soot found behind two primary O-rings. 51- 8/27/1985 61-B 11/26/1985 76 41-G 10/5/1984 78 51- 10/3/1985 79 4 6/27/1982 O-ring condition unknown; rocket casing lost at sea. 51-F 7/29/1985 4 2 76 OOOOO 80 81 0 Insert your graph of O-ring damage as a function of temperature. When constructing your graph, focus on the story you are trying to tell. Creativity is encouraged-there's no single "correct answer", and you don't have to use Microsoft Excel if you'd rather use something else. One last point to remember: the predicted temperature on the morning of the launch was 26-29 F, and the actual temperature of the O-rings at launch may be even lower. Write a 1-paragraph (5-7 sentences) interpretation of the O-ring data, including a recommendation to delay the launch or not. Remember the scientific method! Make comparisons, explain the mechanisms of cause/effect, and explore alternatives. But most importantly, you need to be convincing-after all, your graph and written interpretation may help prevent a disaster


