

Question: on octave please! or mathlab 3. How to create a graph with more than one set of data plotted in it? In the lab 4
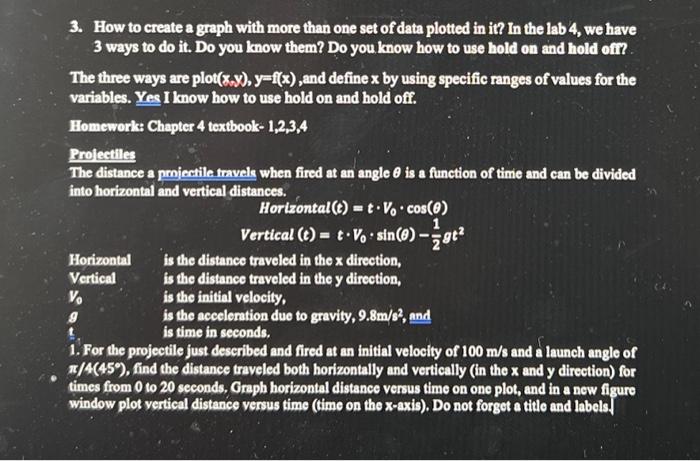
3. How to create a graph with more than one set of data plotted in it? In the lab 4 , we have 3 ways to do it. Do you know them? Do you know how to use hold on and hold ofir? The three ways are plot (x,y),y=f(x), and define x by using specific ranges of values for the variables. Yes I know how to use hold on and hold off. Homework: Chapter 4 textbook- 1,2,3,4 Proleetiles The distance a pmientile travels when fired at an angle is a function of timie and can be divided into horizontal and vertical distances. Horizontal(t)=tV0cos()Vertical(t)=tV0sin()21gt2 Horizontal is the distance traveled in the x direction, Vertical is the distance traveled in the y direction, Y0 is the initial velocity, is the acceleration due to gravity, 9.8m/s2, and is time in seconds, 1. For the projectile just described and fired at an initial velocity of 100m/s and a launch angle of /4(45 ), find the distance traveled both horizontally and vertically (in the x and y direetion) for times from 0 to 20 seconds. Graph horizontal distance versus time on one plot, and in a new figure window plot vertical distance versus time (time on the x-axis). Do not forget a title and labels
Step by Step Solution
There are 3 Steps involved in it

Get step-by-step solutions from verified subject matter experts