

Question: On the following graph, plot Douglas Fur's average total cost curve ( ATC ) using the green points ( triangle symbol ) . Next, plot
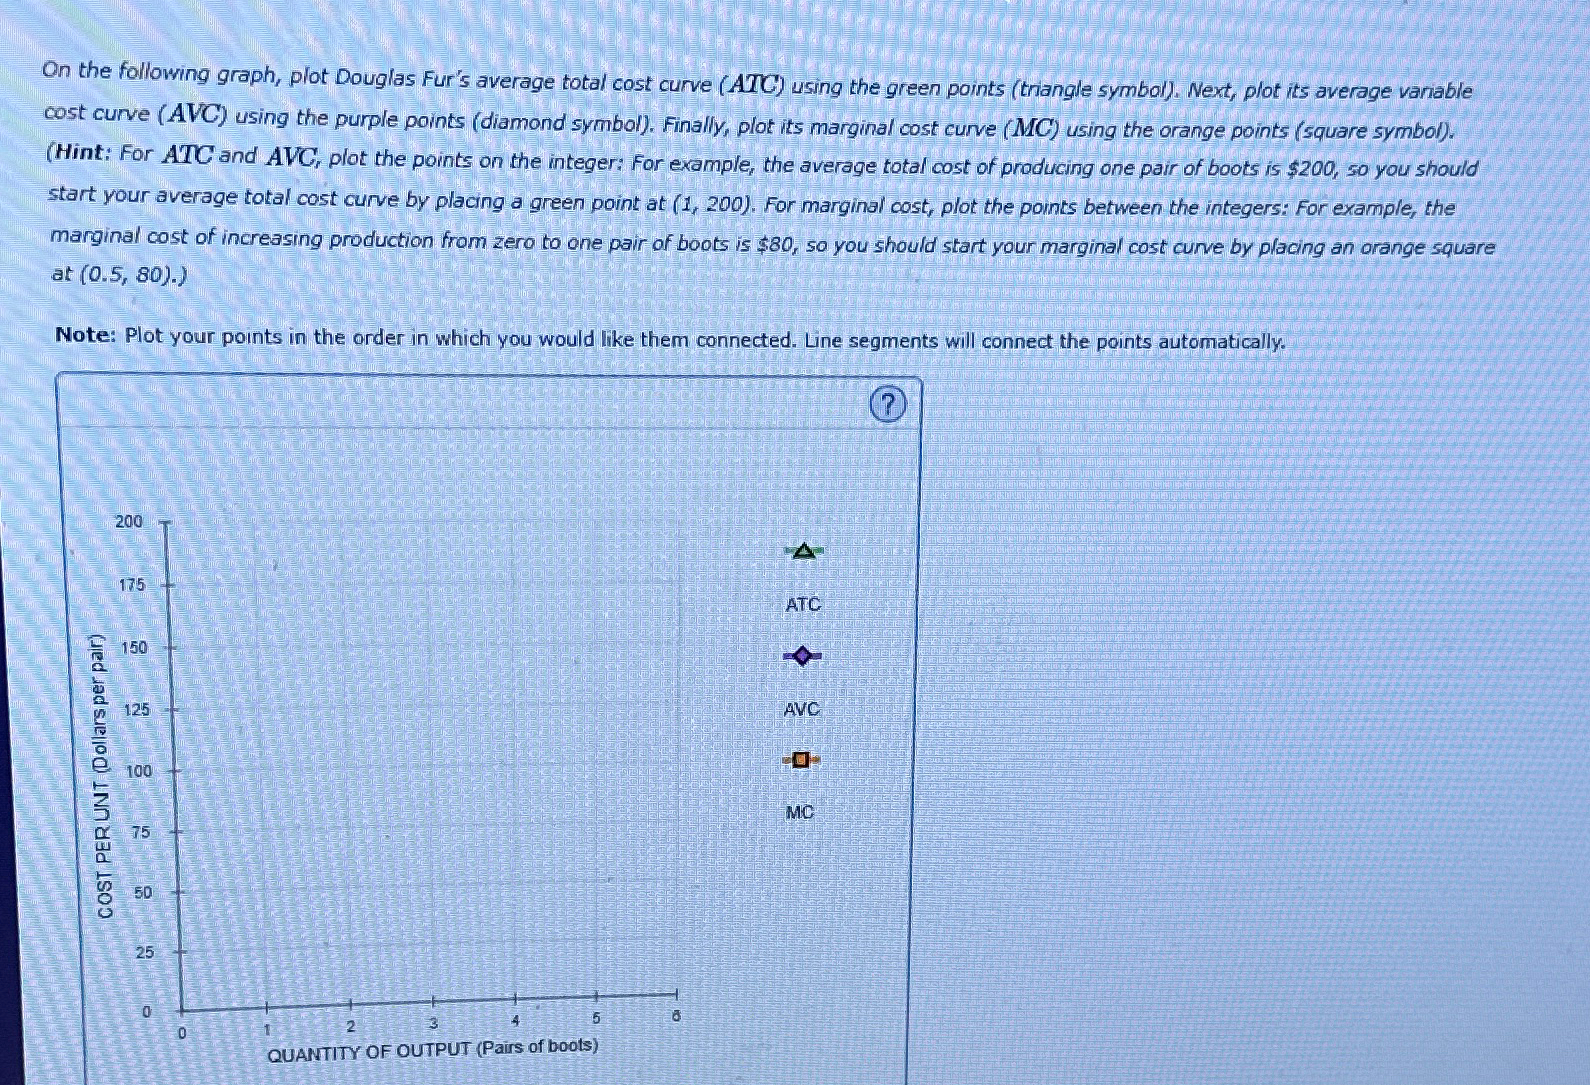
On the following graph, plot Douglas Fur's average total cost curve ATC using the green points triangle symbol Next, plot its average variable cost curve AVC using the purple points diamond symbol Finally, plot its marginal cost curve MC using the orange points square symbol
Hint: For ATC and AVC, plot the points on the integer: For example, the average total cost of producing one pair of boots is $ so you should start your average total cost curve by placing a green point at For marginal cost, plot the points between the integers: For example, the marginal cost of increasing production from zero to one pair of boots is $ so you should start your marginal cost curve by placing an orange square at
Note: Plot your points in the order in which you would like them connected. Line segments will connect the points automatically.
Step by Step Solution
There are 3 Steps involved in it
1 Expert Approved Answer
Step: 1 Unlock

Question Has Been Solved by an Expert!
Get step-by-step solutions from verified subject matter experts
Step: 2 Unlock
Step: 3 Unlock