

Question: On the following graph, plot the yield curve implied by these interest rates. Place a blue point (circle symbol) at each maturity and interest rate
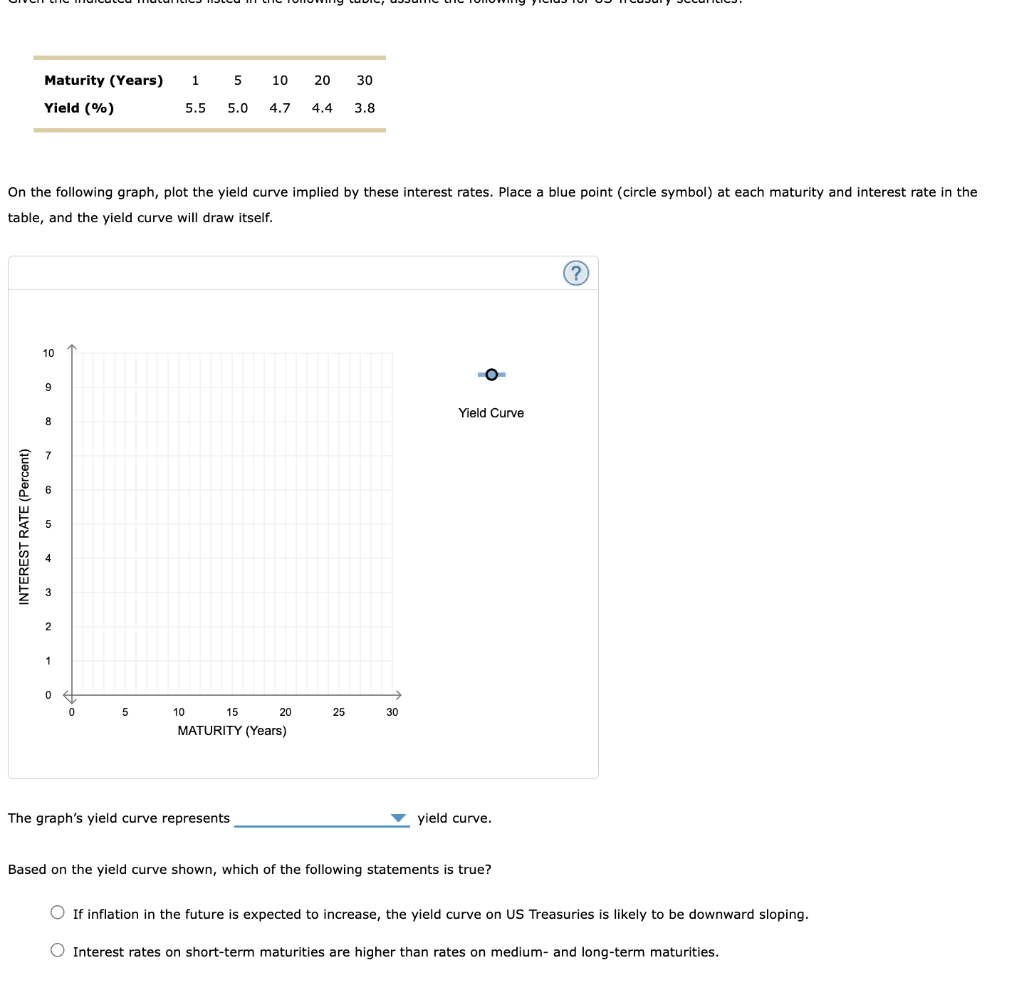
On the following graph, plot the yield curve implied by these interest rates. Place a blue point (circle symbol) at each maturity and interest rate in the table, and the yield curve will draw itself. The graph's yield curve represents yield curve. Based on the yield curve shown, which of the following statements is true? If inflation in the future is expected to increase, the yield curve on US Treasuries is likely to be downward sloping. Interest rates on short-term maturities are higher than rates on medium- and long-term maturities
Step by Step Solution
There are 3 Steps involved in it
1 Expert Approved Answer
Step: 1 Unlock

Question Has Been Solved by an Expert!
Get step-by-step solutions from verified subject matter experts
Step: 2 Unlock
Step: 3 Unlock