

Question: On the following graph, plot the yleld curve implied by these interest rates. Place a blue polnt (circle symbol) at each maturity and interest rate
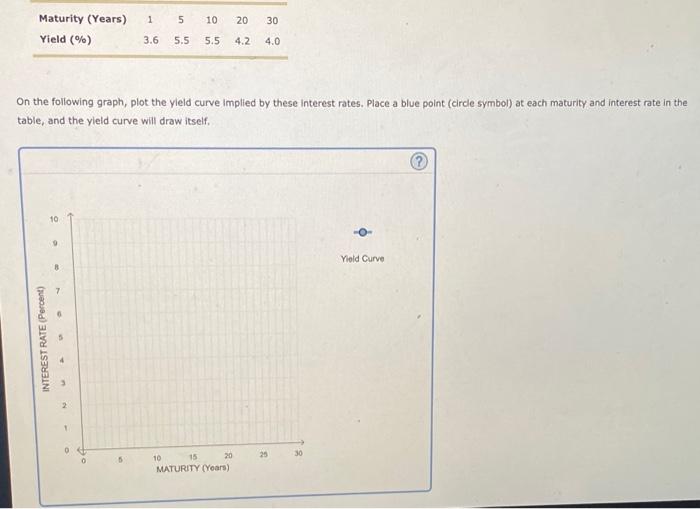

On the following graph, plot the yleld curve implied by these interest rates. Place a blue polnt (circle symbol) at each maturity and interest rate in the table, and the yleld curve will draw itself, The graph's yield curve represents yield curve. Based on the yleld curve shown, which of the following statements is true? Interest rates on medlum-term maturities are higher than rates on long- and short-term maturities. A market with a yield curve as shown on the graph has higher rates on debt securities that mature within 10 to 30 years than those with maturities of less than 1 to 5 years
Step by Step Solution
There are 3 Steps involved in it
1 Expert Approved Answer
Step: 1 Unlock

Question Has Been Solved by an Expert!
Get step-by-step solutions from verified subject matter experts
Step: 2 Unlock
Step: 3 Unlock