

Question: One graph in the figure represents a normal distribution with mean 16 and standard deviation a=1. The other graph represents a normal distribution with
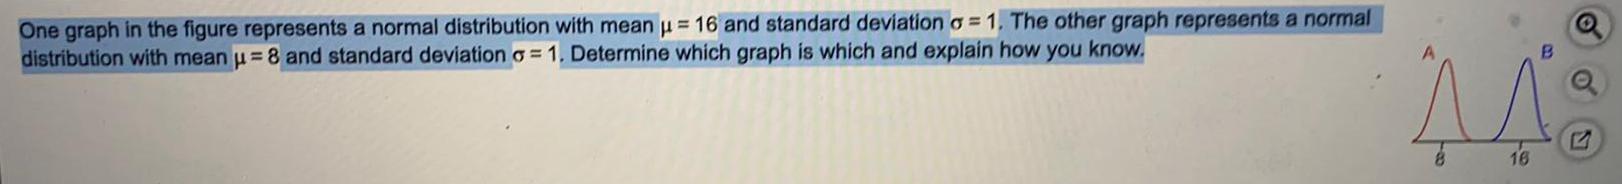
One graph in the figure represents a normal distribution with mean 16 and standard deviation a=1. The other graph represents a normal distribution with mean -8 and standard deviation a 1. Determine which graph is which and explain how you know. E 16
Step by Step Solution
There are 3 Steps involved in it
1 Expert Approved Answer
Step: 1 Unlock

Question Has Been Solved by an Expert!
Get step-by-step solutions from verified subject matter experts
Step: 2 Unlock
Step: 3 Unlock