

Question: One linear function, t(x), can be modeled by the values in the table below. A second linear function can be modeled by the equation 6x
One linear function, t(x), can be modeled by the values in the table below. A second linear function can be modeled by the equation 6x ? y + 4 = 0. When comparing the slopes of these lines, which function has the largest slope and what is this value?
x t(x)
-2 -7
-1 -2
0 -3
1 8
2 13
t(x) has the largest slope: 5.
6x ? y + 4 = 0 has the largest slope: 6.
t(x) has the largest slope:1/5
6x ? y + 4 = 0 has the largest slope:1/6
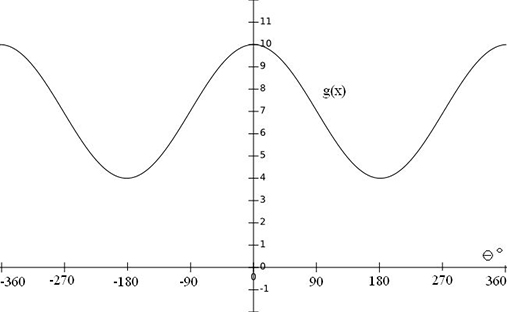
The graph of a sine function, g(x), is depicted below. When compared with the graph of f(x) = 7sin(? + 30) + 4, which function has a greater maximum and what is this value?
\f\f\f
Step by Step Solution
There are 3 Steps involved in it
1 Expert Approved Answer
Step: 1 Unlock

Question Has Been Solved by an Expert!
Get step-by-step solutions from verified subject matter experts
Step: 2 Unlock
Step: 3 Unlock