

Question: One Sample T-Test - Intrinsic Motivation One-Sample Statistics N Mean Std. Deviation Intrinsic Motivation 70 14.3571 2.22656 Std. Error Mean .26612 One-Sample Test Test
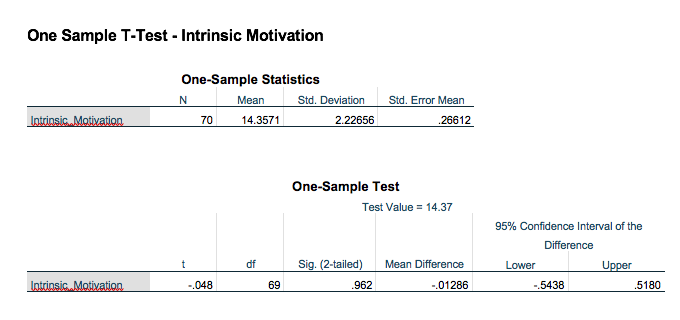
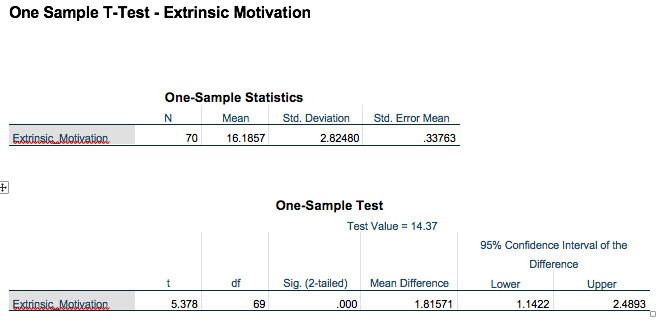
One Sample T-Test - Intrinsic Motivation One-Sample Statistics N Mean Std. Deviation Intrinsic Motivation 70 14.3571 2.22656 Std. Error Mean .26612 One-Sample Test Test Value = 14.37 95% Confidence Interval of the Difference t df Sig. (2-tailed) Mean Difference Lower Upper Intrinsic Motivation -.048 69 .962 -.01286 -.5438 .5180 + One Sample T-Test - Extrinsic Motivation One-Sample Statistics N Mean Std. Deviation Extrinsic Motivation. 70 16.1857 2.82480 Std. Error Mean .33763 One-Sample Test Test Value = 14.37 95% Confidence Interval of the Difference t df Sig. (2-tailed) Mean Difference Lower Upper Extrinsic Motivation 5.378 69 .000 1.81571 1.1422 2.4893
Step by Step Solution
There are 3 Steps involved in it

Get step-by-step solutions from verified subject matter experts