

Question: ONE SAMPLE T-TEST = Variables Data MBF (ml/... 7.21 6.06 Paste Setup Clipboard Edit & ID 1 1 2 2 3 3 4 4
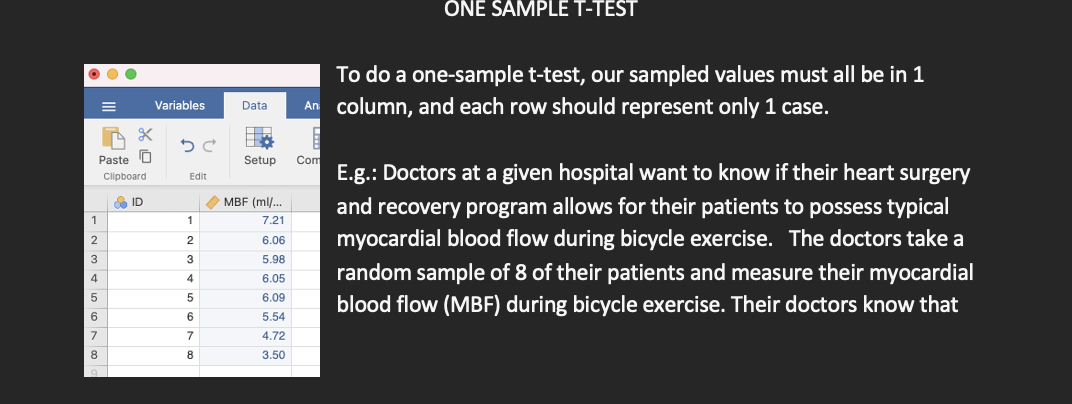
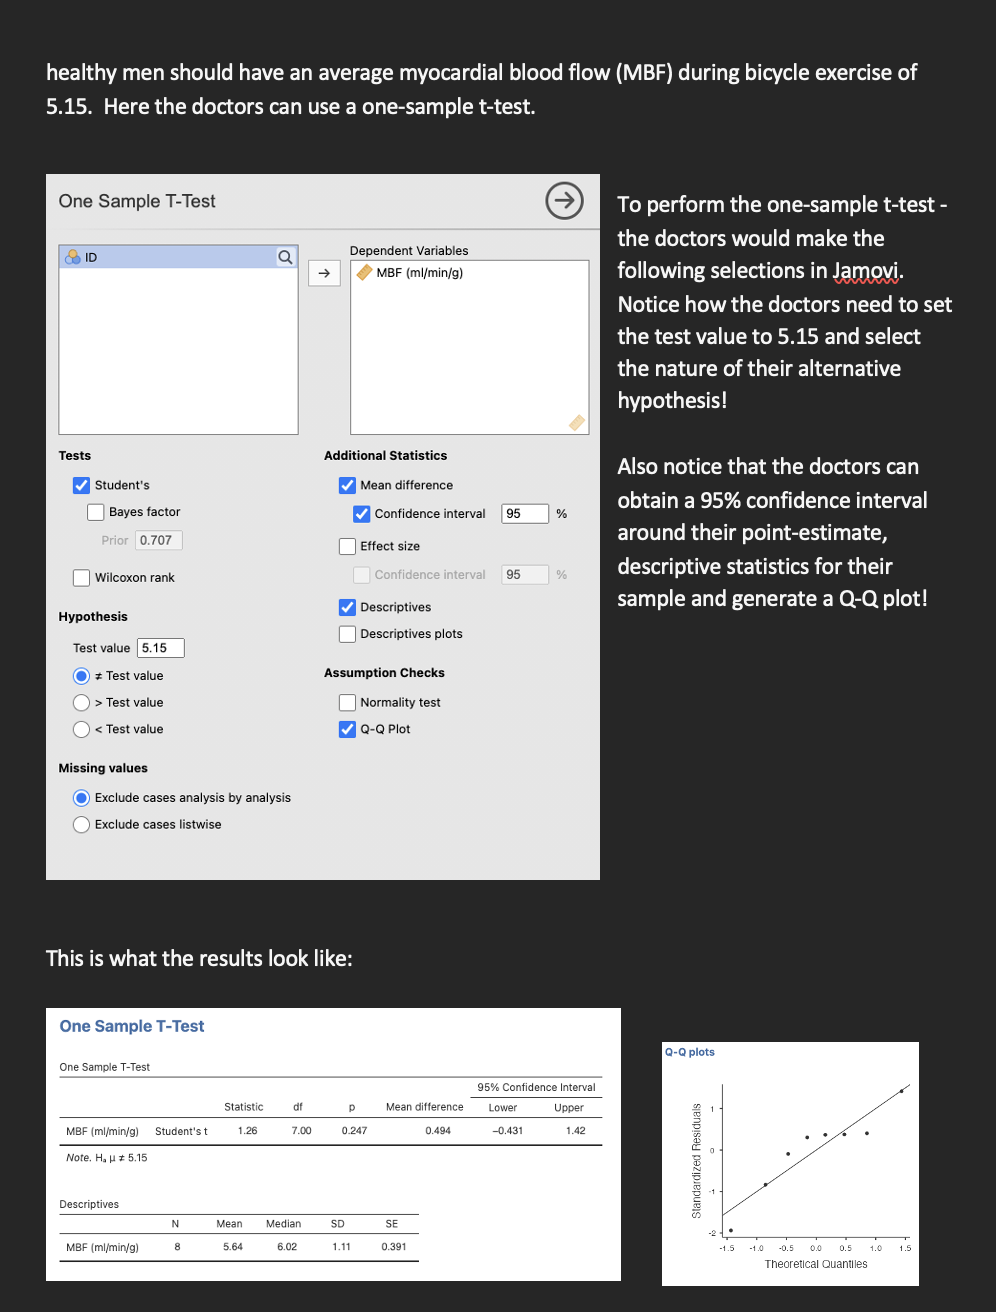

ONE SAMPLE T-TEST = Variables Data MBF (ml/... 7.21 6.06 Paste Setup Clipboard Edit & ID 1 1 2 2 3 3 4 4 6.05 5 5 6 6 5.54 7 7 4.72 8 8 3.50 5.98 6.09 To do a one-sample t-test, our sampled values must all be in 1 An column, and each row should represent only 1 case. Com E.g.: Doctors at a given hospital want to know if their heart surgery and recovery program allows for their patients to possess typical myocardial blood flow during bicycle exercise. The doctors take a random sample of 8 of their patients and measure their myocardial blood flow (MBF) during bicycle exercise. Their doctors know that healthy men should have an average myocardial blood flow (MBF) during bicycle exercise of 5.15. Here the doctors can use a one-sample t-test. One Sample T-Test ID Q Dependent Variables MBF (ml/min/g) Tests Student's Bayes factor Prior 0.707 Wilcoxon rank Hypothesis Test value 5.15 * Test value > Test value < Test value Additional Statistics Mean difference Confidence interval 95 % Effect size Confidence interval 95 % Descriptives Descriptives plots Assumption Checks Normality test Q-Q Plot Missing values Exclude cases analysis by analysis Exclude cases listwise This is what the results look like: One Sample T-Test One Sample T-Test MBF (ml/min/g) Note. Ha 5.15 Descriptives 95% Confidence Interval Statistic df Mean difference Lower Upper Student's t 1.26 7.00 0.247 0.494 -0.431 1.42 N Mean Median SD SE MBF (ml/min/g) 8 5.64 6.02 1.11 0.391 To perform the one-sample t-test- the doctors would make the following selections in Jamovi. Notice how the doctors need to set the test value to 5.15 and select the nature of their alternative hypothesis! Also notice that the doctors can obtain a 95% confidence interval around their point-estimate, descriptive statistics for their sample and generate a Q-Q plot! Q-Q plots Standardized Residuals 0.5 1.0 1.5 Theoretical Quantiles 3) Please perform a one-sample t-test by hand using output from this table and interpret the results. If there is a significant difference, make sure to interpret the point estimate relative to the null in the context of the hypothesis test. a) First locate of then go to top if its two-tailed or one-tailed and you get t-value
Step by Step Solution
There are 3 Steps involved in it

Get step-by-step solutions from verified subject matter experts