

Question: One spreadsheet assignment involved financial ratio analysis. The financial statements for the company are listed below. What is the Excel formula needed to calculate the
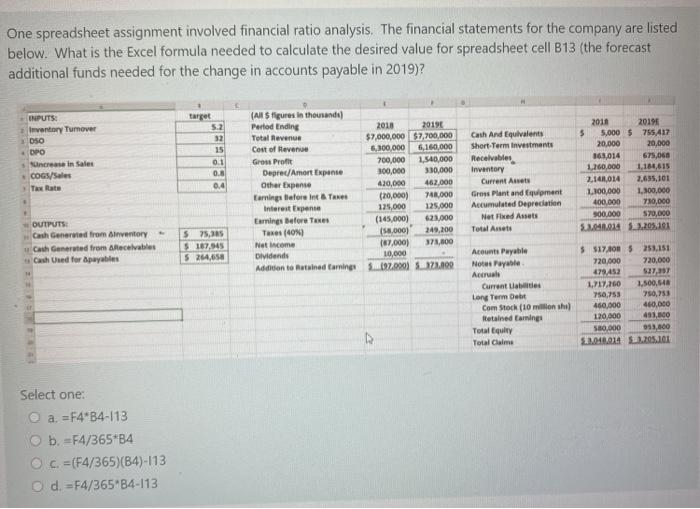
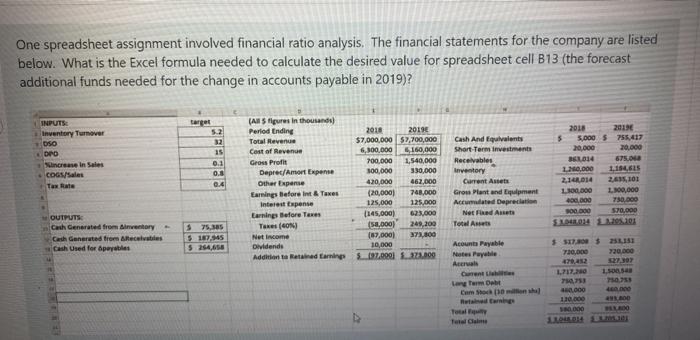
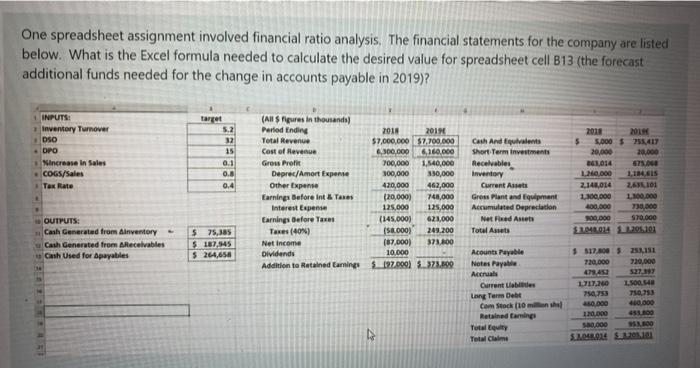
One spreadsheet assignment involved financial ratio analysis. The financial statements for the company are listed below. What is the Excel formula needed to calculate the desired value for spreadsheet cell B13 (the forecast additional funds needed for the change in accounts payable in 2019? INPUTS: Inventory Turnover OSO target 5.2 32 OPO increase in sales COGS/Sales 15 0.1 0.8 0.4 (All Stigures in thousands) Perlod Ending Total Revenue Cost of Revenue Gross Profit Deprec/AmortExpense Other Expense Earnings Before it & Tax Interest Expense Earnings Before Taxes Taxes (40N Net income Dividende Addition to twined tannings 2010 2019 $7,000,000 $7,700,000 6,300,000 6,160,000 700,000 1,540,000 300,000 330,000 420,000 462,000 (20,000) 748.000 125,000 125.000 (145,000) 623,000 158,000) 249,200 (87.000) 373,000 10,000 (92000) .22.000 Cash And Equivalent Short-Term investments Receivables Inventory Current Assets Gros Plant and Equipment Accumulated Depreciation NetFixed Assets Total Assets 2010 2014 5 5,000 $ 79,417 20,000 20,000 363,014 675,066 1260,000 1,184,615 2.141,014 2,655,101 1.100,000 1.300.000 400,000 780,000 500.000 $70,000 1.041.014 3.3.205.101 OUTPUTS: Cash Generated from inventory Cash Generated from tecelables Cash red for payables $ 25,00 $187.945 5 264,658 Acourt Puyable Notes Payable Accrual Current Labis Long Term Debt Comstock (10 million shi) Retained Earning Total Equity Total Claims 5 $1708 5253.151 720,000 720,000 479452 1,717,260 1,500,548 750,75 750,753 460,000 460,000 120,000 490,000 50,000 953,000 512.04.014 1.205.101 Select one: a = F4B4-113 O b. =F4/365*34 O c. =(F4/365)(B4)-113 Od =F4/365 B4-113 One spreadsheet assignment involved financial ratio analysis. The financial statements for the company are listed below. What is the Excel formula needed to calculate the desired value for spreadsheet cell B13 (the forecast additional funds needed for the change in accounts payable in 2019)? target INPUTS: Inventory Tummover OSO DRO increase in Sales COGS Tax Rate 12 15 0.1 0.8 0.4 (Alls figures in thousands) Period Ending Total Revenue Cost of Revenue Gross Profit Deprec/Amort Expense Other Expense Earnings Before Int & Taxes Interest Expense Earnings Before Taxes Taxes (40) Net Income Dividende Addition to Ratind Earning 2018 2019 $7,000,000 $7,700,000 6,100,000 5160,000 700.000 1,540,000 300,000 330,000 420,000 462,000 (20,000) 748.000 125,000 125.000 (145,000) 625,000 (5.00) 249,209 (87.000) 273,800 10,000 $197.000 71.000 Cash And Equivalent Short Term investments Receivables Inventory Current Assets Grom Plant and Equipment Acumulated Depreciation Net Fed Annet Total Arts 2018 2018 5.00$ 755,417 20,000 20,000 361,014 675.0 0.000 1.154 2,14014 2015101 110.000 L100,000 40.000 750.000 0.000 590.000 SL4014 LMS101 $ 75,385 OUTPUTS: Cath Generated from inventory Cash Generated from Recettes Cash Used for Speyebies $ 284,656 17.00 70. Acounts Payable Notes Puyabile Acer Current Long term Debt Cum social 720.000 27,30 1,500 1.717.10 71073 40.000 000 One spreadsheet assignment involved financial ratio analysis. The financial statements for the company are listed below. What is the Excel formula needed to calculate the desired value for spreadsheet cell B13 (the forecast additional funds needed for the change in accounts payable in 2019)? INPUTS: Inventory Turnover DSO OPO Nincrease in Sales COGS/Sales Tax Rate target 5.2 32 15 0.1 0. (All Figures in thousands) Period Ending 2018 2019 Total Revenue $7,000,000 $2,700.000 Cost of Revenue 6,300,000 6160.000 Grow Profit 700,000 1.540,000 Deprec/Amort Expense 300,000 350,000 Other Expense 420,000 462,000 Earnings Before Int & Taxes (20,000) 748,000 Interest Expense 125,000 125,000 Earnings Before Texas (145,000) 621,000 Taxes (40%) ISL.000) 249.200 Net Income (87.000) 373.800 Dividends 10.000 Addition to Retained Earnings $197.000) $2.323.00 0.4 2018 20 5 5.000 $ 755,417 20,000 20.000 161014 675. 1.200,000 2.141014 26101 1.300.000 1.800.000 100.000 730.000 100.000 S70.000 1041014 1295.107 Cash And Equivalents Short Term investments Receivables Inventory Current Asus Gross Plant and Equipment Accumulated Depreciation Net Fred Assets Total Assets OUTPUTS: Cash Generated from Anventory Cash Generated from Receivables Cash Used for Apayables $ 75,385 $ 187,145 $ 264,656 Acounts Payable Notes Payable Acer Current Labs Long Term Debt Com Stock (10 min Retained Gaming Total Equity Total Claims $317.00 $ 253,151 720,000 720,000 479.45 1717,260 1.500.540 T50, 753 400.000 451 120.000 O 100
Step by Step Solution
There are 3 Steps involved in it

Get step-by-step solutions from verified subject matter experts