

One way of experimentally measuring the frequency response is to plot the output sine wave versus the
Fantastic news! We've Found the answer you've been seeking!
Question:
One way of experimentally measuring the frequency response is to plot the output sine wave versus the input sine wave. The results of such a plot look like Fig. P15-4. This is the sinusoidal deviation in output versus sinusoidal deviation in input and appears as an ellipse centered at the origin. Show how to obtain the AR and phase lag from this plot. 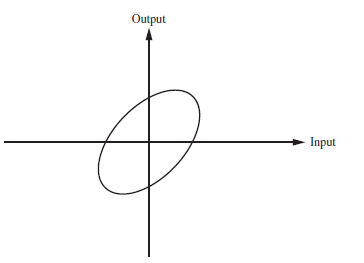
Expert Answer:

Related Book For 

Fundamentals of Physics
ISBN: 978-0471758013
8th Extended edition
Authors: Jearl Walker, Halliday Resnick
Posted Date:
