

Question: One-Sample Statistics Std. Error N Mean Std. Deviation Mean 77.70 11.451 3.524 One-Sample 'Best I Test Value = 89 95% Confidence Interval of the Difference
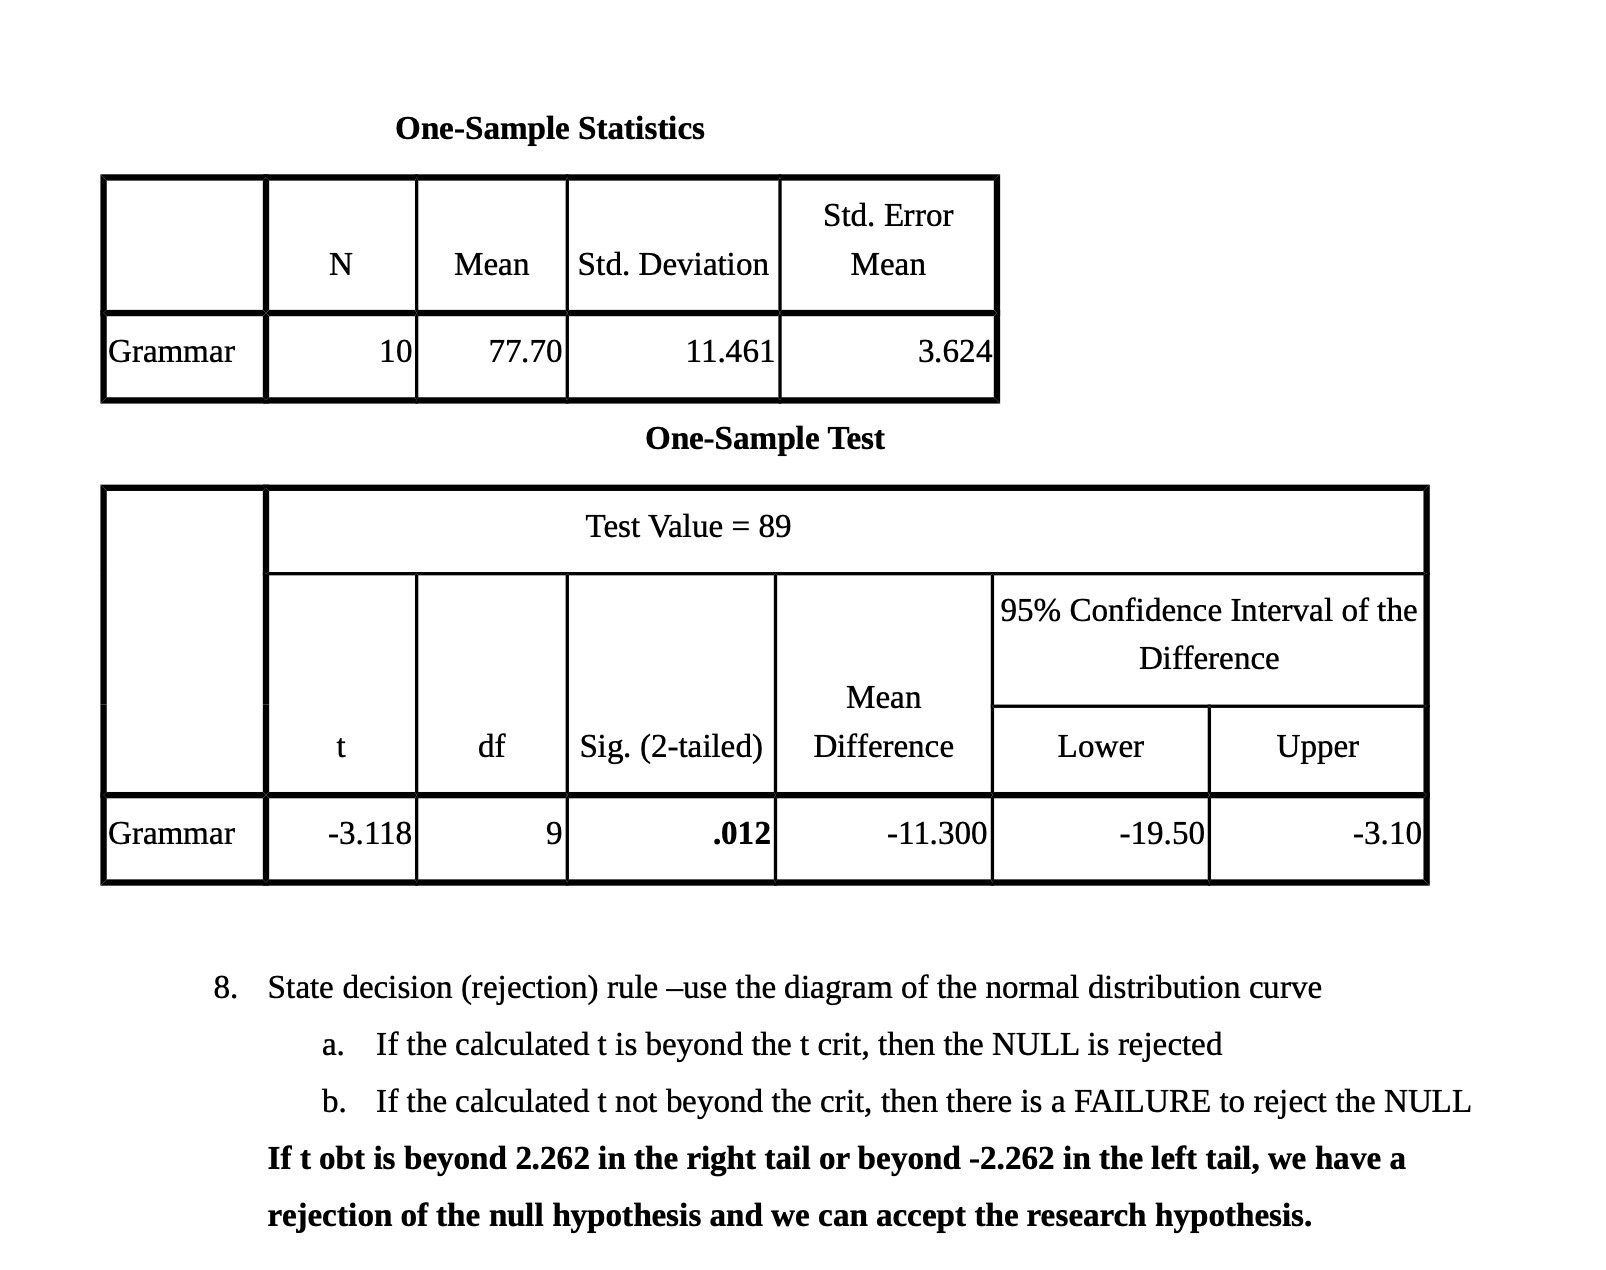
One-Sample Statistics Std. Error N Mean Std. Deviation Mean 77.70 11.451 3.524 One-Sample 'Best I Test Value = 89 95% Confidence Interval of the Difference Mean t Sig. (2-tailed) Difference 8. State decision (rejection) rule use the diagram of the normal distribution cuwe a. If the calculated t is beyond the t crit, then the NULL is rejected b. If the calculated t not beyond the crit, then there is a FAILURE to reject the NULL If t obt is beyond 2.262 in the right tail or beyond -2.262 in the left tail, we have a rejection of the null hypothesis and we can accept the research hypothesis
Step by Step Solution
There are 3 Steps involved in it
1 Expert Approved Answer
Step: 1 Unlock

Question Has Been Solved by an Expert!
Get step-by-step solutions from verified subject matter experts
Step: 2 Unlock
Step: 3 Unlock