

Question: + Oneway Descriptives R WEIGHT RATING 95% Confidence Interval for Mean Std N Mean Deviation Std. Error Lower Bound Upper Bound Minimum Maximum VERY HAPPY
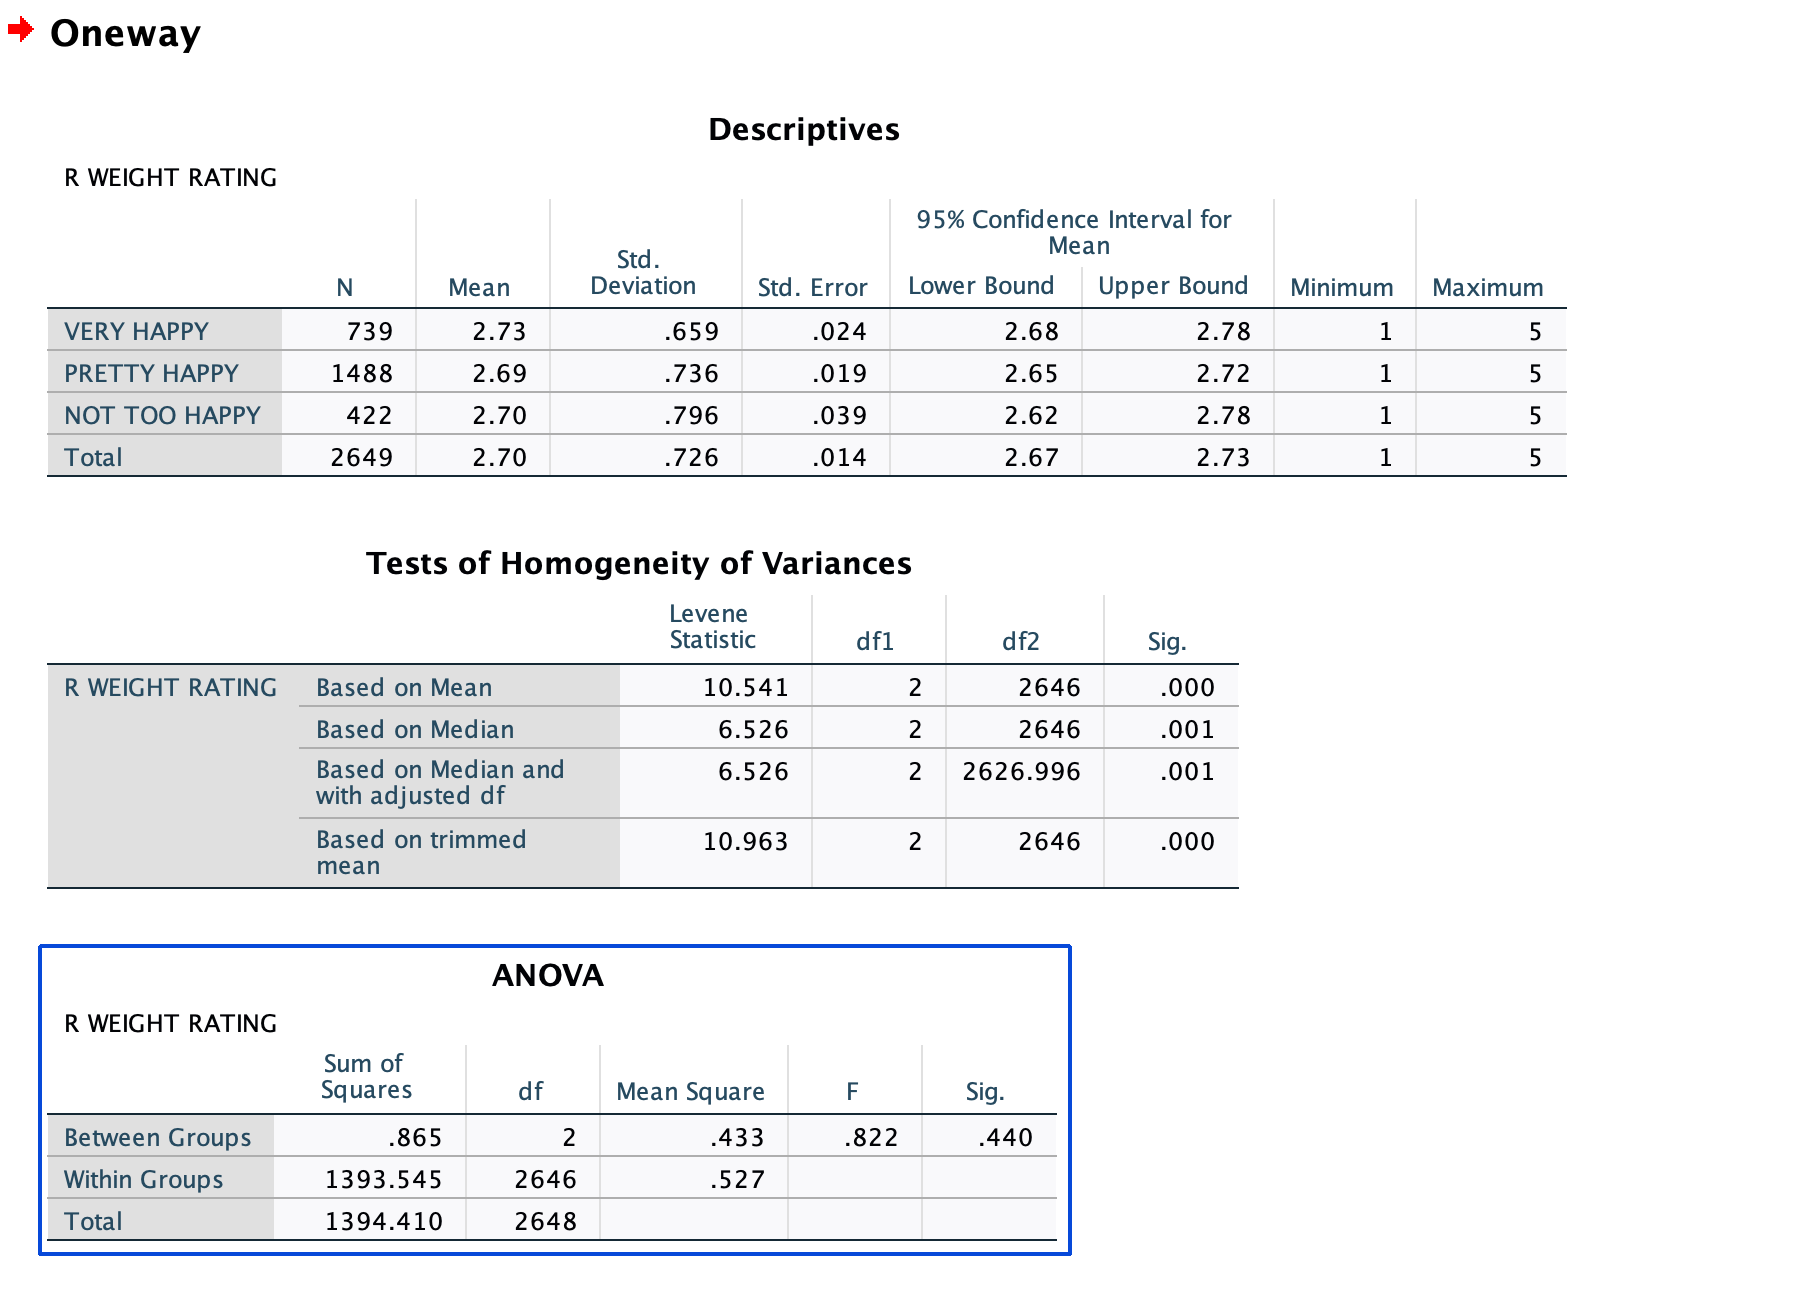
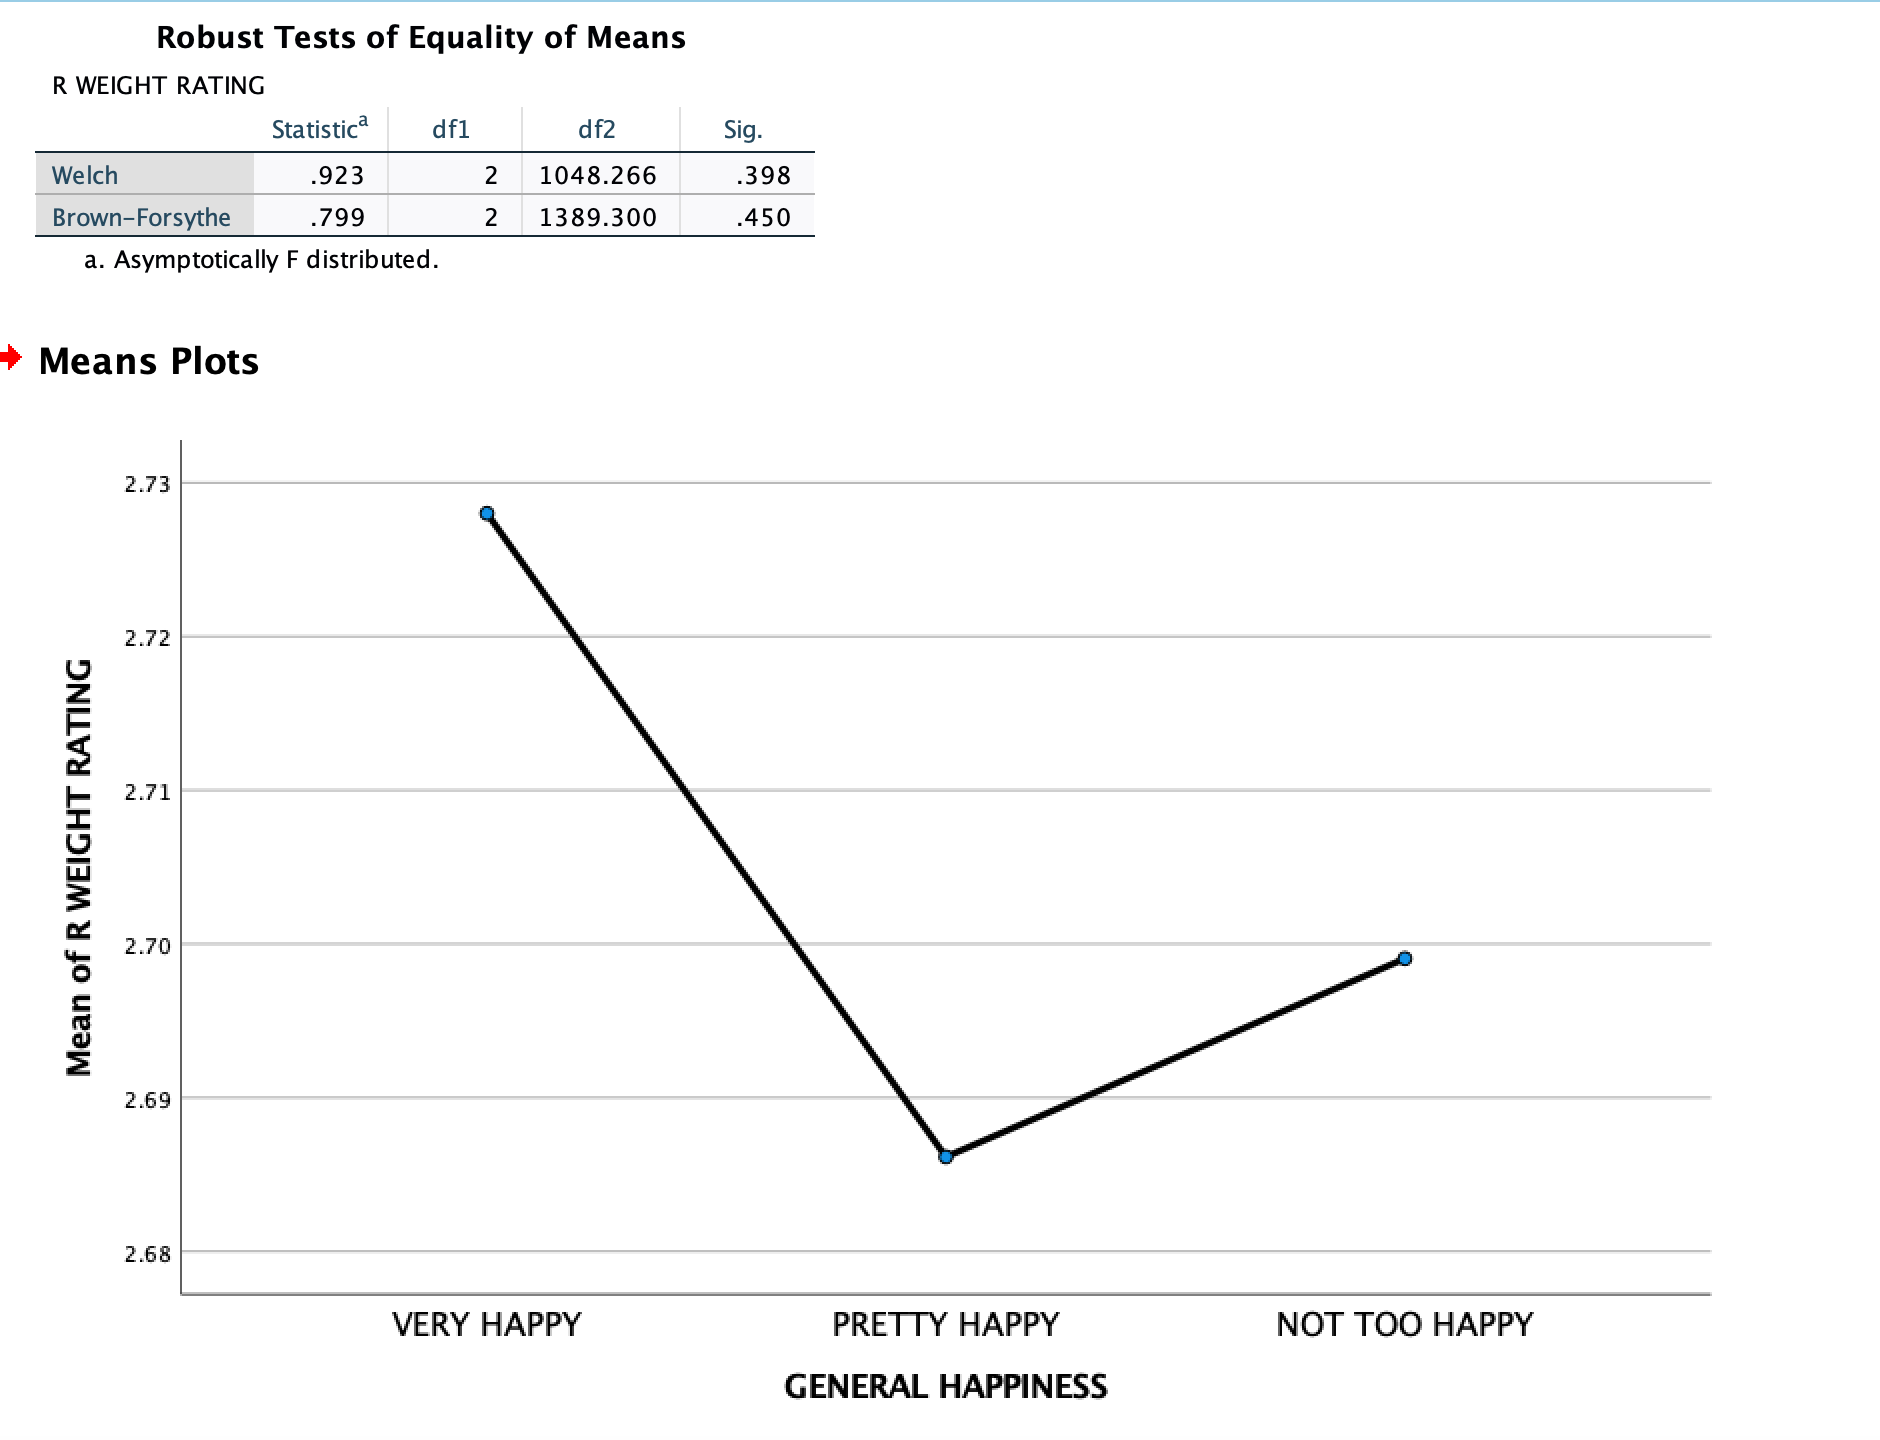
+ Oneway Descriptives R WEIGHT RATING 95% Confidence Interval for Mean Std N Mean Deviation Std. Error Lower Bound Upper Bound Minimum Maximum VERY HAPPY 739 2.73 659 024 2.68 2.78 1 5 PRETTY HAPPY 1488 2.69 .736 .019 2.65 2.72 H 5 NOT TOO HAPPY 422 2.70 .796 039 2.62 2.78 5 H H Total 2649 2.70 .726 .014 2.67 2.73 5 Tests of Homogeneity of Variances Levene Statistic df1 df2 Sig. R WEIGHT RATING Based on Mean 10.541 2 2646 000 Based on Median 6.526 2 2646 001 Based on Median and 6.526 2 2626.996 001 with adjusted df Based on trimmed 10.963 2 2646 000 mean ANOVA R WEIGHT RATING Sum of Squares df Mean Square F Sig. Between Groups 865 2 433 822 .440 Within Groups 1393.545 2646 .527 Total 1394.410 2648Robust Tests of Equality of Means R WEIGHT RATING Statistica df1 df2 Sig. Welch 923 2 1048.266 398 Brown-Forsythe 799 2 1389.300 450 a. Asymptotically F distributed. Means Plots 2.73 2.72 2.71 Mean of R WEIGHT RATING 2.70 2.69 2.68 VERY HAPPY PRETTY HAPPY NOT TOO HAPPY GENERAL HAPPINESS
Step by Step Solution
There are 3 Steps involved in it

Get step-by-step solutions from verified subject matter experts