

Question: !!!!!!!ONLY ANSWER USING EXCEL PLEASE!!!!! 41 A cash flow diagram for a project at Billco is shown below. 42 43 Years Initial Cost Salvage Op
 !!!!!!!ONLY ANSWER USING EXCEL PLEASE!!!!!
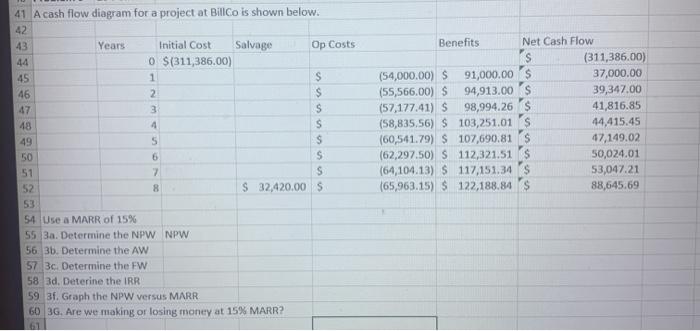
 41 A cash flow diagram for a project at Billco is shown below. 42 43 Years Initial Cost Salvage Op Costs 44 0 $(311,386.00) 45 1 S 46 2 $ 47 3 S 48 4 S 49 5 S 50 6 S 51 7 S 52 8 S 32,420.00 S 53 54 Use a MARR of 15% 55 3a. Determine the NPW NPW 56. 36. Determine the AW 57 3c Determine the FW 58 3d. Deterine the IRR 59 3f. Graph the NPW versus MARR 60 3G. Are we making or losing money at 15% MARR? Benefits Net Cash Flow S (311,386.00) (54,000.00) 91,000.00 $ 37,000.00 (55,566.00) $ 94,913.00 $ 39,347.00 (57,177.41) 5 98,994.26 $ 41,816.85 (58,835,56) S 103,251.01'S 44,415.45 (60,541.79) $ 107,690.81 S 47,149.02 (62,297.50) S 112,321,51 $ 50,024.01 (64,104.13) $ 117,151.34 S 53,047.21 (65,963.15) $ 122,188.84 88,645.69
Step by Step Solution
There are 3 Steps involved in it

Get step-by-step solutions from verified subject matter experts