

Question: only give answer E answer of ABCD https://www.chegg.com/homework-help/questions-and-answers/question-invest-two-risky-assets-b-risk-free-asset-return-5--expected-return-standard-devi-q25046699 only give answer E answer of ABCD https://www.chegg.com/homework-help/questions-and-answers/question-invest-two-risky-assets-b-risk-free-asset-return-5--expected-return-standard-devi-q25046699 Question i You can invest in two risky assets
only give answer E
answer of ABCD
https://www.chegg.com/homework-help/questions-and-answers/question-invest-two-risky-assets-b-risk-free-asset-return-5--expected-return-standard-devi-q25046699
only give answer E
answer of ABCD
https://www.chegg.com/homework-help/questions-and-answers/question-invest-two-risky-assets-b-risk-free-asset-return-5--expected-return-standard-devi-q25046699
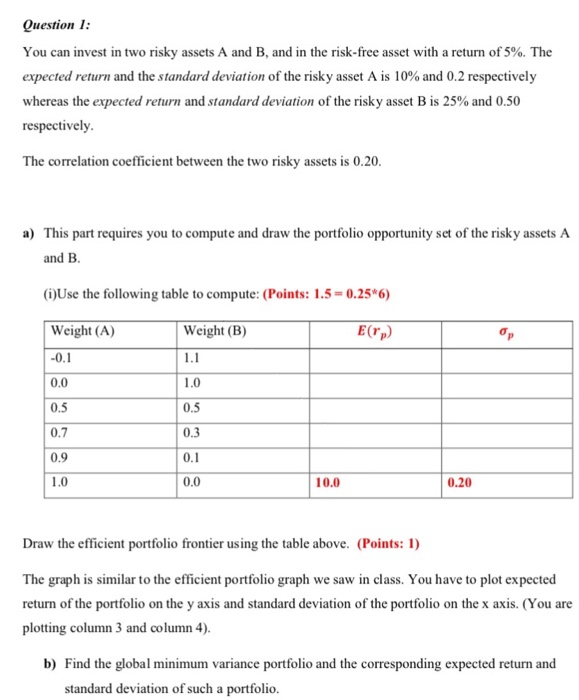
Question i You can invest in two risky assets A and B, and in the risk-free asset with a return of 5%. The expected return and the standard deviation of the risky asset A is 10% and 0.2 respectively whereas the expected return and standard deviation of the risky asset B is 25% and 0.50 respectively The correlation coefficient between the two risky assets is 0.20 a) This part requires you to compute and draw the portfolio opportunity set of the risky assets A and B (i)Use the following table to compute: (Points: 1.5 = 0.25*6) Weight (A) Weight (B) E(rp) 0.0 0.5 0.7 0.9 1.0 1.0 0.5 0.3 0.0 10.0 0.20 Draw the efficient portfolio frontier using the table above. (Points: 1) The graph is similar to the efficient portfolio graph we saw in class. You have to plot expected return of the portfolio on the y axis and standard deviation of the portfolio on the x axis. (You are plotting column 3 and column 4) b) Find the global minimum variance portfolio and the corresponding expected return and standard deviation of such a portfolio. Question i You can invest in two risky assets A and B, and in the risk-free asset with a return of 5%. The expected return and the standard deviation of the risky asset A is 10% and 0.2 respectively whereas the expected return and standard deviation of the risky asset B is 25% and 0.50 respectively The correlation coefficient between the two risky assets is 0.20 a) This part requires you to compute and draw the portfolio opportunity set of the risky assets A and B (i)Use the following table to compute: (Points: 1.5 = 0.25*6) Weight (A) Weight (B) E(rp) 0.0 0.5 0.7 0.9 1.0 1.0 0.5 0.3 0.0 10.0 0.20 Draw the efficient portfolio frontier using the table above. (Points: 1) The graph is similar to the efficient portfolio graph we saw in class. You have to plot expected return of the portfolio on the y axis and standard deviation of the portfolio on the x axis. (You are plotting column 3 and column 4) b) Find the global minimum variance portfolio and the corresponding expected return and standard deviation of such a portfolio
Step by Step Solution
There are 3 Steps involved in it

Get step-by-step solutions from verified subject matter experts