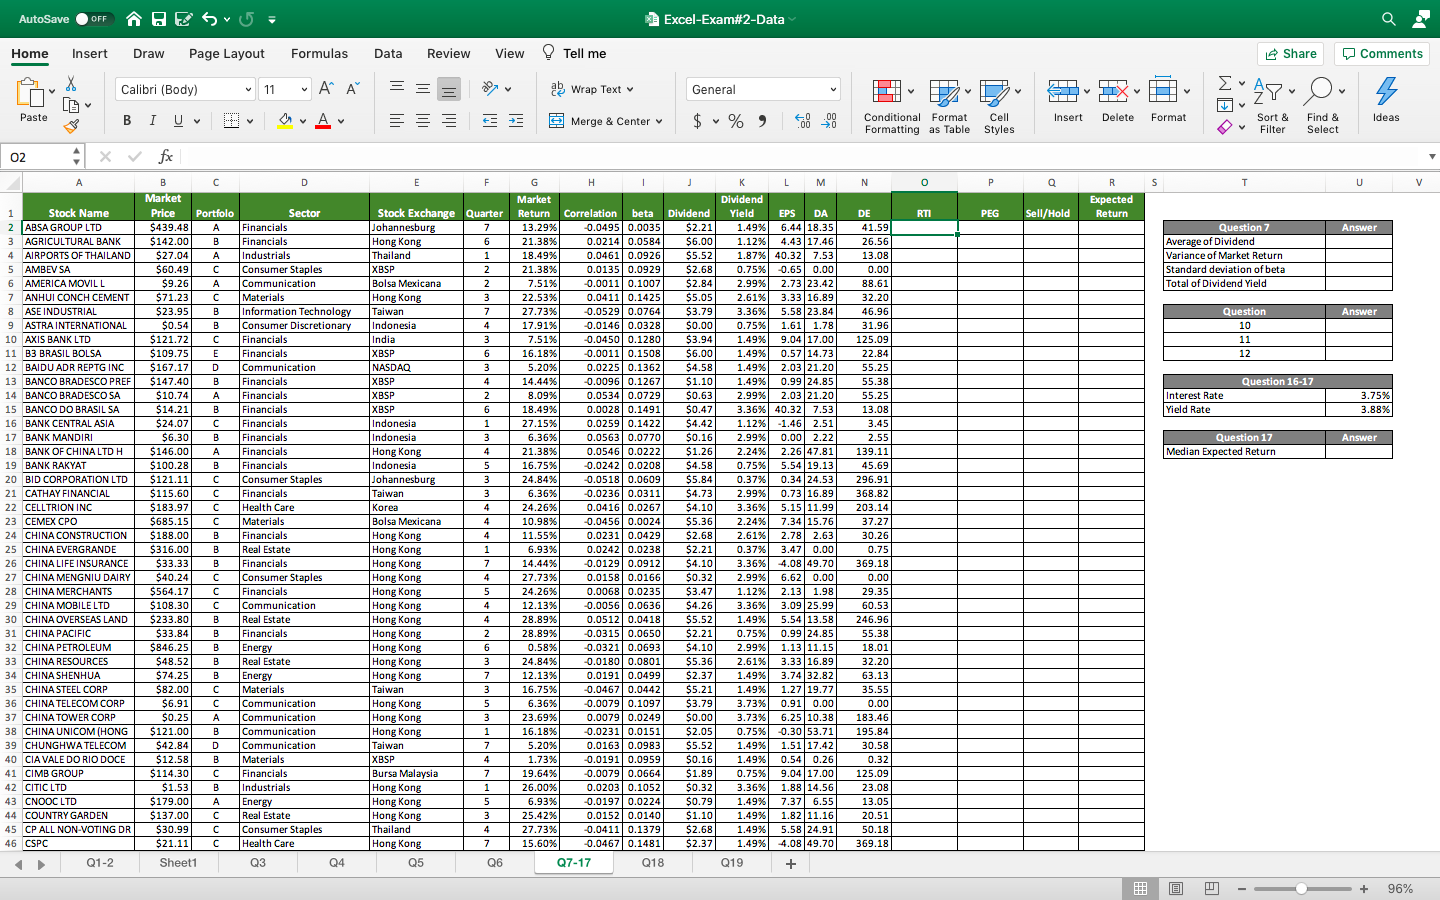
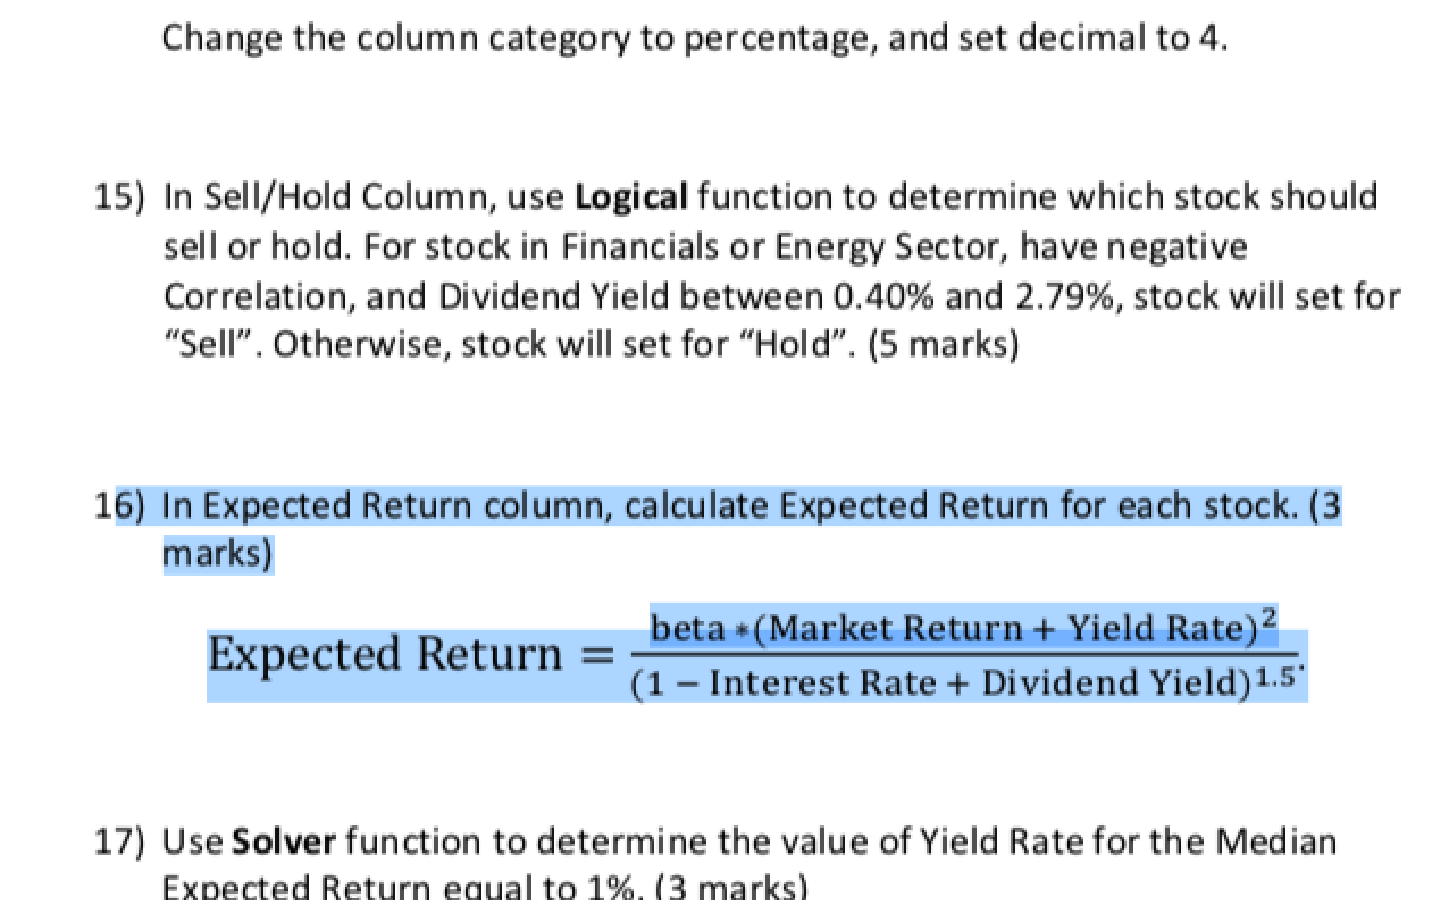
Question: Only need help with question 15, table goes to N136 AutoSave OFF ES5= Excel-Exam#2-Data Home Insert Draw Page Layout Formulas Data Review View Tell me

Only need help with question 15, table goes to N136

Only need help with question 15, table goes toOnly need help with question 15, table goes to

AutoSave OFF ES5= Excel-Exam#2-Data Home Insert Draw Page Layout Formulas Data Review View Tell me Share Comments X Calibri (Body) V I = = 11 ab Wrap Text v General V PPA SL LIX 49 O s Paste B I U v A E $ %) .00 .00 0 3 Merge & Center Insert Delete Format Ideas Conditional Format Formatting as Table Cell Styles v Sort & Filter Find & Select 02 x fox A B D E F N O P Q s T U V R Expected Return RTI PEG Sell/Hold Answer Question 7 Average of Dividend Variance of Market Return Standard deviation of beta Total of Dividend Yield Answer Question 10 11 12 Question 16-17 Interest Rate Yield Rate 3.75% 3.88% Answer Question 17 Median Expected Return 1 Stock Name 2 2 ABSA GROUP LTD 3 3 AGRICULTURAL BANK 4 AIRPORTS OF THAILAND 5 AMBEV SA 6 AMERICA MOVILL 7 ANHUI CONCH CEMENT 8 ASE INDUSTRIAL 9 ASTRA INTERNATIONAL 10 AXIS BANK LTD 11 B3 BRASIL BOLSA 12 BAIDU ADR REPTG INC 13 BANCO BRADESCO PREF 14 BANCO BRADESCO SA 15 BANCO DO BRASIL SA 16 BANK CENTRAL ASIA 17 BANK MANDIRI 18 BANK OF CHINA LTD H 19 BANK RAKYAT 20 BID CORPORATION LTD 21 CATHAY FINANCIAL 22 CELLTRION INC 23 CEMEX CPO 24 CHINA CONSTRUCTION 25 CHINA EVERGRANDE 26 CHINA LIFE INSURANCE 27 CHINA MENGNIU DAIRY 28 CHINA MERCHANTS 29 CHINA MOBILE LTD 30 CHINA OVERSEAS LAND 31 CHINA PACIFIC 32 CHINA PETROLEUM 33 CHINA RESOURCES 34 CHINA SHENHUA 35 CHINA STEEL CORP 36 CHINA TELECOM CORP 37 CHINA TOWER CORP 38 CHINA UNICOM (HONG 39 CHUNGHWA TELECOM 40 CIA VALE DO RIO DOCE 41 CIMB GROUP 42 CITIC LTD 43 CNOOC LTD 44 COUNTRY GARDEN 45 CP ALL NON-VOTING DR 46 CSPC Market Price $439.48 $142.00 $27.04 $60.49 $9.26 $71.23 $23.95 $0.54 $121.72 $109.75 $167.17 $147.40 $10.74 $14.21 $24.07 $6.30 $146.00 $100.28 $121.11 $115.60 $183.97 $685.15 $188.00 $316.00 $33.33 $40.24 $564.17 $108.30 $233.80 $33.84 $846.25 $48.52 $74.25 $82.00 $6.91 $0.25 $121.00 $42.84 $12.58 $ $114.30 $1.53 $179.00 $137.00 $ $30.99 $21.11 Portfolo Sector A Financials B Financials A Industrials C Consumer Staples A Communication Materials B Information Technology B Consumer Discretionary C Financials E Financials D Communication B Financials A Financials B Financials Financials B Financials A Financials B Financials C Consumer Staples Financials Health Care C C Materials B Financials B Real Estate B Financials C Consumer Staples Financials Communication B Real Estate B Financials B Energy B Real Estate B Energy Materials Communication A Communication B Communication D Communication B Materials Financials B Industrials A Energy Real Estate Consumer Staples Health Care Stock Exchange Quarter Johannesburg 7 Hong Kong 6 Thailand 1 1 XBSP 2 Bolsa Mexicana 2 Hong Kong 3 Taiwan 7 Indonesia 4 India 3 XBSP 6 NASDAQ 3 XBSP 4 XBSP 2 XBSP 6 Indonesia 1 Indonesia 3 Hong Kong 4 Indonesia 5 Johannesburg 3 Taiwan 3 Korea 4 Bolsa Mexicana 4 Hong Kong 4 Hong Kong 1 Hong Kong 7 Hong Kong 4 Hong Kong 5 Hong Kong 4 Hong Kong 4 Hong Kong 2 Hong Kong 6 G Hong Kong 3 Hong Kong 7 Taiwan 3 Hong Kong 5 Hong Kong 3 Hong Kong 1 Taiwan 7 XBSP 4 Bursa Malaysia 7 Hong Kong 1 Hong Kong 5 Hong Kong 3 Thailand 4 Hong Kong 7 Q5 Q6 G H 1 Market Return Correlation beta 13.29% -0.0495 0.0035 21.38% 0.0214 0.0584 18.49% 0.0461 0.0926 21.38% 0.0135 0.0929 7.51% -0.0011 0.1007 22.53% 0.0411 0.1425 27.73% -0.0529 0.0764 17.91% % -0.0146 0.0328 7.51% -0.0450 0.1280 16.18% 0.0011 0.1508 5.20% 0.02251 0.1362 14.44% -0.0096 0.1267 8.09% 0.0534 0.0729 18.49% 0.0028 0.1491 27.15% 0.0259 0.1422 6.36% 0.0563 0.0770 21.38% 0.0546 0.0222 16.75% -0.0242 0.0208 24.84% -0.0518 0.0609 6.36% -0.0236 0.0311 24.26% 0.0416 0.0267 10.98% -0.0456 0.0024 11.55% 0.0231 0.0429 6.93% 0.0242 0.0238 14.44% -0.0129 0.0912 27.73% 0.0158 0.0166 24.26% 0.0068 0.0235 12.13% -0.0056 0.0636 28.89% 0.0512 0.0418 28.89% -0.0315 0.0650 0.58% -0.0321 0.0693 24.84% -0.0180 0.0801 12.13% 0.01911 0.0499 16.75% -0.0467 0.0442 6.36% % -0.0079 0.1097 23.69% 0.00791 0.0249 16.18% -0.0231 0.0151 5,20% 0.0163 0.0983 1.73% -0.0191 0.0959 19.64% -0.0079 0.0664 26.00% 0.0203 0.1052 6.93% -0.0197 0.0224 25.42% 0.0152 0.0140 27.73% -0.0411 0.1379 15.60% -0.0467 0.1481 Q7-17 Q18 L M Dividend Dividend Yield EPS DA $2.21 1.49% 6.4418.35 $6.00 1.12% 4.43 17.46 $5.52 1.87% 40.32 7.53 $2.68 0.75% 0.65 0.00 $2.84 2.99% 2.7323.42 $5.05 2.61% 3.33 16.89 $3.79 3.36% 5.58 23.84 $0.00 0.75% 1.61 1.78 $3.94 1.49% 9.04 17.00 $6.00 1.49% 0.57 14.73 $4.58 1.49% 2.03 21.20 $1.10 1.49% 0.9924.85 $0.63 2.99% 2.03 21.20 $0.47 3.36% 40.32 7.53 $4.42 1.12% -1.46 2.51 $0.16 2.99% 0.00 2.22 $1.26 2.24% 2.26 47.81 $4.58 0.75% 5.54 19.13 $5.84 0.37% 0.34 24.53 $4.73 2.99% 0.73 16.89 $4.10 3.36% 5.15 11.99 $5.36 2.24% 7.3415.76 $2.68 2.61% 2.781 2.63 $2.21 0.37% 3.47 0.00 $4.10 3.36% 4.08 49.70 $0.32 2.99% 6.62 0.00 $3.47 1.12% 2.13 1.98 $4.26 3.36% 3.0925.99 $5.52 1.49% 5.54 13.58 $2.21 0.75% 0.99 24.85 $4.10 2.99% 1.13 11.15 $5.36 2.61% 3.33 16.89 $2.37 1.49% 3.74 32.82 $5.21 1.49% 1.27 19.77 $3.79 3.73% 0.91 0.00 $0.00 3.73% 6.25 10.38 $2.05 0.75% -0.3053.71 $5.52 1.49% 1.51 17.42 $0.16 1.49% 0.54 0.26 $1.89 0.75% 9.04 17.00 $0.32 3.36% 1.88 14.56 $0.79 1.49% 7.37 6.55 $1.10 1.49% 1.82|11.16 $2.68 1.49% 5.58 24.91 $2.37 1.49% 4.08 49.70 Q19 + DE 41.59 26.56 13.08 0.00 88.61 32.20 46.96 31.96 125.09 22.84 55.25 55.38 55.25 13.08 3.45 2.55 139.11 45.69 296.91 368.82 203.14 37.27 30.26 0.75 369.18 0.00 29.35 60.53 246.96 55.38 18.01 32.20 63.13 35.55 0.00 183.46 195.84 30.58 0.32 125.09 23.08 13.05 20.51 50.18 369.18 Q1-2 Sheet1 Q3 Q4 + 96% Change the column category to percentage, and set decimal to 4. 15) In Sell/Hold Column, use Logical function to determine which stock should sell or hold. For stock in Financials or Energy Sector, have negative Correlation, and Dividend Yield between 0.40% and 2.79%, stock will set for "Sell". Otherwise, stock will set for "Hold". (5 marks) 16) In Expected Return column, calculate Expected Return for each stock. (3 marks) beta +(Market Return + Yield Rate) Expected Return = (1 - Interest Rate + Dividend Yield) 1.5 17) Use Solver function to determine the value of Yield Rate for the Median Expected Return equal to 1%

Step by Step Solution

There are 3 Steps involved in it

1 Expert Approved Answer
Step: 1 Unlock blur-text-image
Question Has Been Solved by an Expert!

Get step-by-step solutions from verified subject matter experts

Step: 2 Unlock
Step: 3 Unlock

Students Have Also Explored These Related General Management Questions!