

Question: Only need part A for this problem data is provided Search Marquis X M Topic: M3 Step 9a: Group Can X A Chapter 3.2 Homework
Only need part A for this problem data is provided
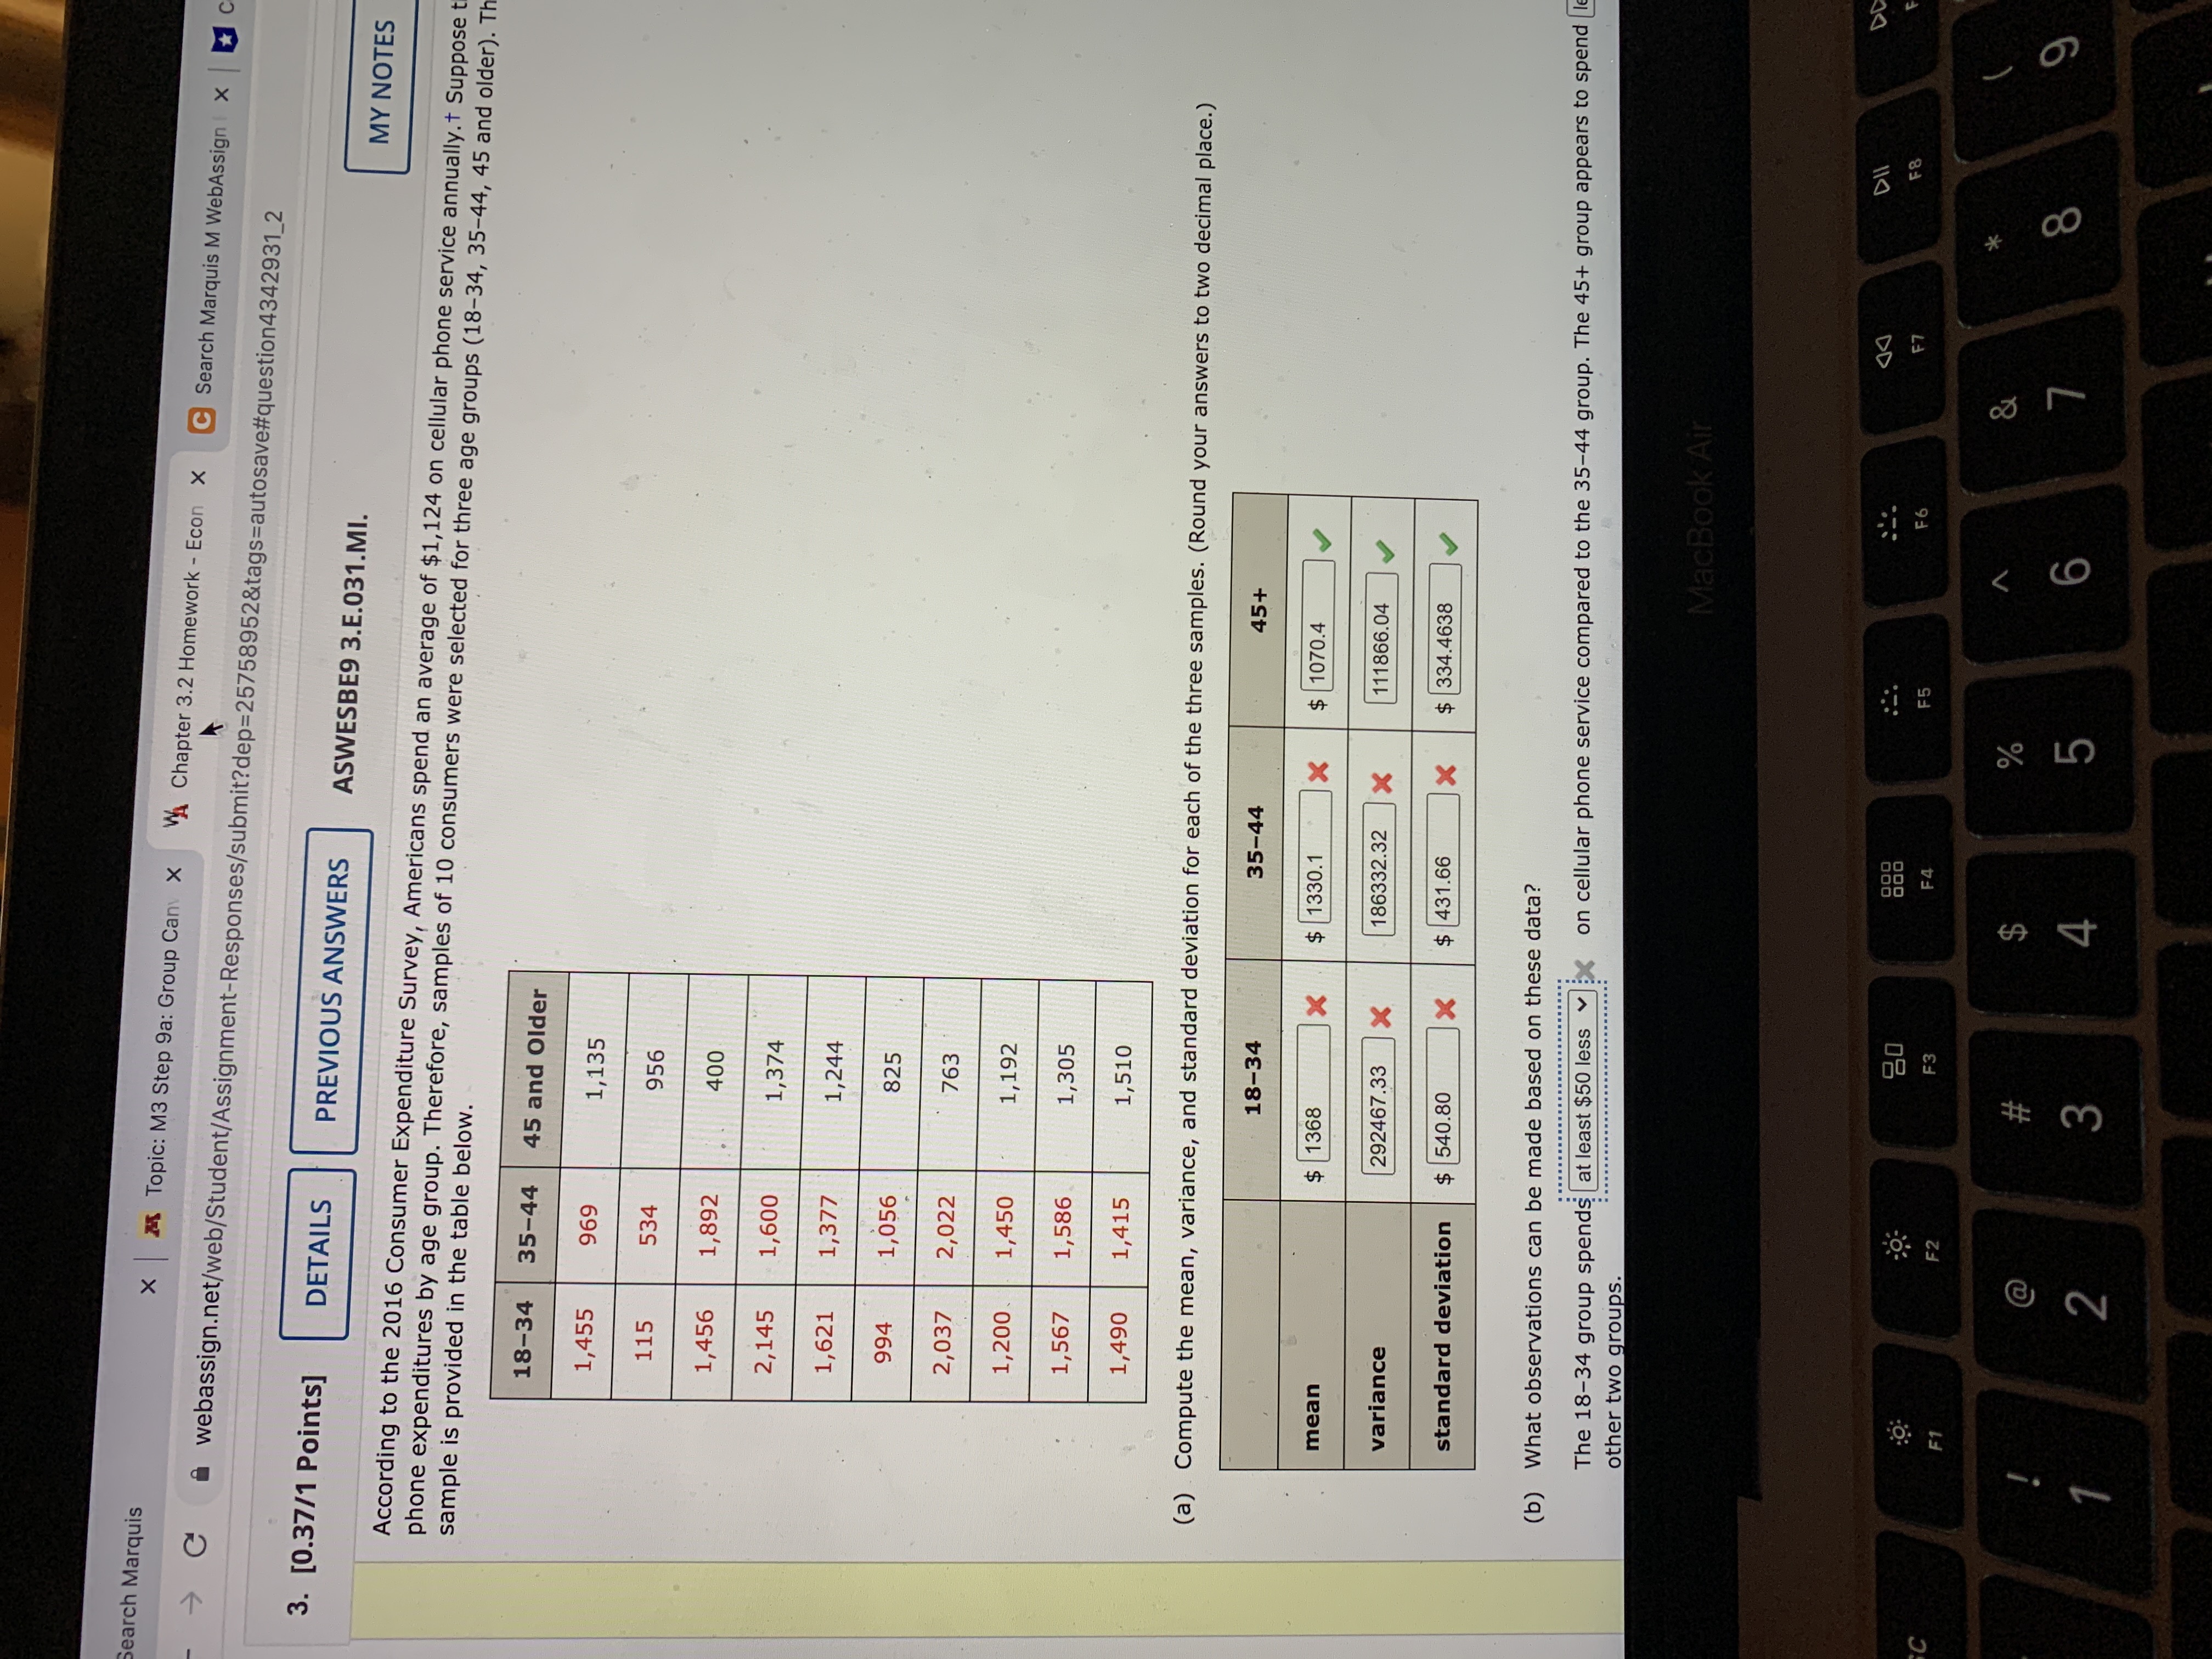
Search Marquis X M Topic: M3 Step 9a: Group Can X A Chapter 3.2 Homework - Econ x C Search Marquis M WebAssign | x C webassign.net/web/Student/Assignment-Responses/submit? dep=25758952&tags=autosave#question4342931_2 3. [0.37/1 Points] DETAILS PREVIOUS ANSWERS ASWESBE9 3.E.031.MI. MY NOTES According to the 2016 Consumer Expenditure Survey, Americans spend an average of $1,124 on cellular phone service annually. + Suppose phone expenditures by age group. Therefore, samples of 10 consumers were selected for three age groups (18-34, 35-44, 45 and older). T sample is provided in the table below. 18-34 35-44 45 and Older 1,455 969 1,135 115 534 956 1,456 1,892 400 2,145 1,600 1,374 1,621 1,377 1,244 994 1,056 825 2,037 2,022 763 1,200. 1,450 1,192 1,567 1,586 1,305 1,490 1,415 1,510 (a) Compute the mean, variance, and standard deviation for each of the three samples. (Round your answers to two decimal place.) 18-34 35-44 45+ mean $ 1368 X $ 1330.1 X $ 1070.4 variance 292467.33 X 186332.32 X 111866.04 standard deviation $ 540.80 X $ 431.66 X $ 334.4638 (b) What observations can be made based on these data? The 18-34 group spends at least $50 less v X on cellular phone service compared to the 35-44 group. The 45+ group appears to spend[ other two groups. MacBook Air DII DO 20 888 FB F6 E7 F2 F3 F4 F5 F1 # % 8 9 3 4 5 N
Step by Step Solution
There are 3 Steps involved in it

Get step-by-step solutions from verified subject matter experts