

Question: only solve d) Following table presents normal and crash times and costs for each activity. Activity Precedence ID Cost 80 Direct costs Maximum Normal Crash
only solve d)
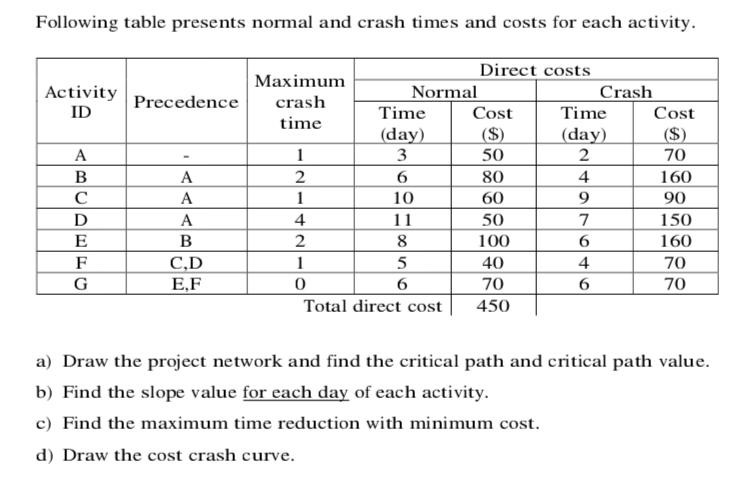
Following table presents normal and crash times and costs for each activity. Activity Precedence ID Cost 80 Direct costs Maximum Normal Crash crash Time Time Cost time (day) (day) ($) SO 70 160 90 11 50 7 150 100 6 160 40 4 70 70 Total direct cost 450 10 60 C,D 70 E.F a) Draw the project network and find the critical path and critical path value. b) Find the slope value for each day of each activity. c) Find the maximum time reduction with minimum cost. d) Draw the cost crash curveStep by Step Solution
There are 3 Steps involved in it
1 Expert Approved Answer
Step: 1 Unlock

Question Has Been Solved by an Expert!
Get step-by-step solutions from verified subject matter experts
Step: 2 Unlock
Step: 3 Unlock