

Question: Only the last two pages are there for the question. Other color pages were wrong sorry. TABLE 3-1 Micro Drive Inc.: Balance Sheets and Income
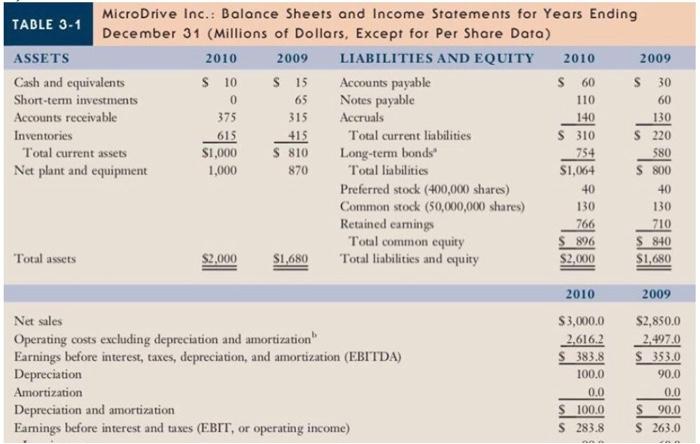
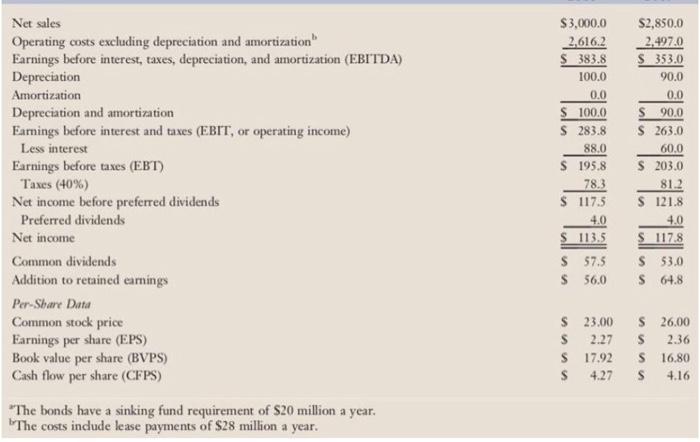
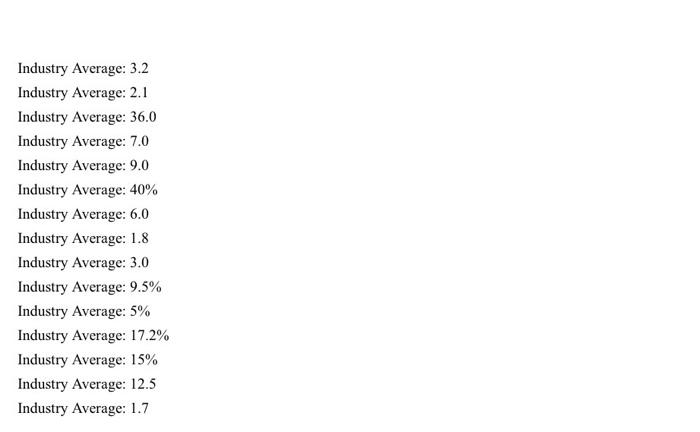
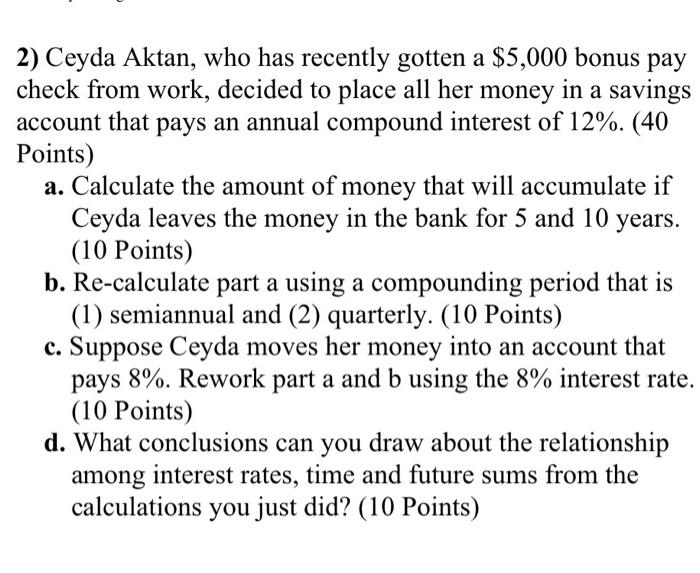
TABLE 3-1 Micro Drive Inc.: Balance Sheets and Income Statements for Years Ending December 31 (Millions of Dollars. Except for Per Share Data) ASSETS 2010 2009 LIABILITIES AND EQUITY 2010 2009 Cash and equivalents $ 10 S 15 Accounts payable S60 $ 30 Short-term investments 0 65 Notes payable 110 60 Accounts receivable 375 315 Accruals 140 130 Inventories 615 415 Total current liabilities S 310 $ 220 Total current assets $1,000 S 810 Long-term bonds 754 580 Net plant and equipment 1,000 870 Total liabilities $1,064 S 800 Preferred stock (400,000 shares) 40 40 Common stock (50,000,000 shares) 130 Retained earnings 766 Total common equity $ 896 S 840 Total assets $2,000 S1,680 Total liabilities and equity $2,000 $1,680 130 710 2010 2009 Net sales Operating costs excluding depreciation and amortization Earnings before interest, taxes, depreciation, and amortization (EBITDA) Depreciation Amortization Depreciation and amortization Earnings before interest and taxes (EBIT, or operating income) $3,000.0 2.616.2 S383.8 100.0 0.0 S 100.0 S 283.8 S2,850.0 2.497.0 S 353.0 90.0 0.0 S 90.0 S 263.0 Net sales Operating costs excluding depreciation and amortization" Earnings before interest, taxes, depreciation, and amortization (EBITDA) Depreciation Amortization Depreciation and amortization Earnings before interest and taxes (EBIT, or operating income) Less interest Earnings before taxes (EBT) Taxes (40%) Net income before preferred dividends Preferred dividends Net income Common dividends Addition to retained earnings Per-Share Data Common stock price Earnings per share (EPS) Book value per share (BVPS) Cash flow per share (CFPS) "The bonds have a sinking fund requirement of $20 million a year. The costs indude lease payments of $28 million a year. $3,000.0 2.616.2 383.8 100.0 0.0 $ 100.0 S 283.8 88.0 $ 195,8 78.3 $ 117.5 4.0 S 113.5 $ 57.5 $ 56.0 $2,850.0 2,497.0 $ 353.0 90.0 0.0 S90.0 $ 263.0 60.0 S 203.0 81.2 $ 121.8 4.0 S 117.8 $ 53.0 S 64.8 $ 23,00 $26.00 $ 2.27 $ 2.36 $17.92 $ 16.80 S 4.27 s 4.16 Industry Average: 3.2 Industry Average: 2.1 Industry Average: 36.0 Industry Average: 7.0 Industry Average: 9.0 Industry Average: 40% Industry Average: 6.0 Industry Average: 1.8 Industry Average: 3.0 Industry Average: 9.5% Industry Average: 5% Industry Average: 17.2% Industry Average: 15% Industry Average: 12.5 Industry Average: 1.7 2) Ceyda Aktan, who has recently gotten a $5,000 bonus pay check from work, decided to place all her money in a savings account that pays an annual compound interest of 12%. (40 Points) a. Calculate the amount of money that will accumulate if Ceyda leaves the money in the bank for 5 and 10 years. (10 Points) b. Re-calculate part a using a compounding period that is (1) semiannual and (2) quarterly. (10 Points) c. Suppose Ceyda moves her money into an account that pays 8%. Rework part a and b using the 8% interest rate. (10 Points) d. What conclusions can you draw about the relationship among interest rates, time and future sums from the calculations you just did? (10 Points)
Step by Step Solution
There are 3 Steps involved in it

Get step-by-step solutions from verified subject matter experts