

Question: Only three small question, help please Question 2 (40 marks) It is noticed that the above estimated sample regression model (Ib) is not so satisfactory,
Only three small question, help please 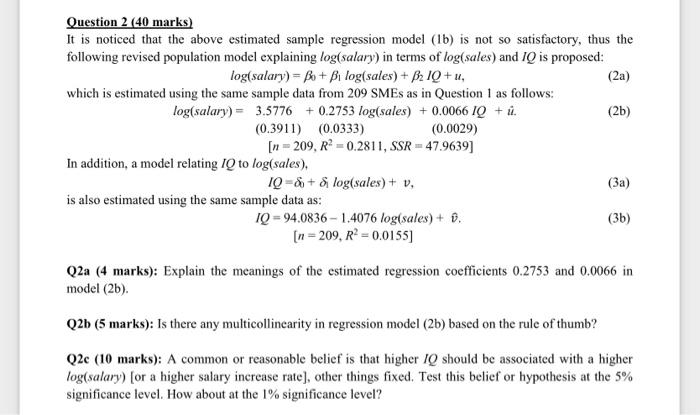
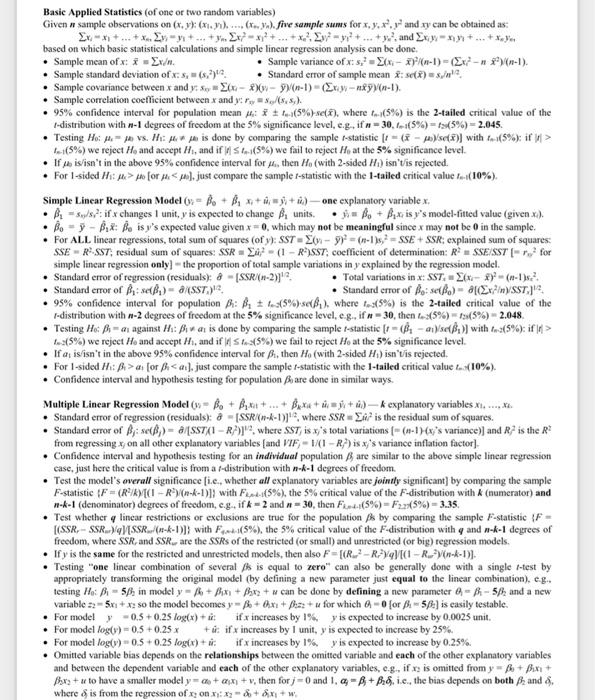
Question 2 (40 marks) It is noticed that the above estimated sample regression model (Ib) is not so satisfactory, thus the following revised population model explaining log( salary) in terms of log(sales) and IQ is proposed: log( salary )=0+1log( sales )+2lQ+u which is estimated using the same sample data from 209 SMEs as in Question 1 as follows: log(salary)=3.5776+0.2753log(sales)(0.3911)0.0066IQ+u.[n=209,R2=0.2811,SSR=47.9639] In addition, a model relating IQ to log( sales), IQ=0+1log(sales)+v, is also estimated using the same sample data as: IQ=94.08361.4076log(sales)+v^.[n=209,R2=0.0155] Q2a (4 marks): Explain the meanings of the estimated regression coefficients 0.2753 and 0.0066 in model (2b). Q2b (5 marks): Is there any multicollinearity in regression model (2b) based on the rule of thumb? Q2e (10 marks): A common or reasonable belief is that higher IQ should be associated with a higher log( salary) [or a higher salary increase rate], other things fixed. Test this belief or hypothesis at the 5% significance level. How about at the 1% significance level? Basic Applied Statistics (of one or two random variables) Given n sample observations on (x,y) : (x1,y1)...., (xn,yn). five sample sums for x,y,x2,y2 and xy can be obtained as: based on which basic statistical calculations and simple linear regression analysis can be done. - Sample mean of x:x=x1 - Sample variance of x:sx2=(xix)2(n1)=(xi2nx2)(n1). - Sample standard deviation of x:sy=(ss2)1/2 - Standard error of sample mean x^:se(x^)=s,n112. - Sample covariance between x and yix0=(xix)(yy)((n1)=(xi,yinxy)(n1). - Sample correlation coefficient between x and y:rxy=sc/(szsz). - 95% confidence interval for population mean 1:xte1(5%)se(x), where tn1(5%) is the 2-tailed critical value of the t-distribution with n1 degrees of freedom at the 5% significance level, e.g, if n=30,t(5%)=f2(5%)=2.045. - Testing H0:4=0 vs. H1:1=0 is done by comparing the sample t-statistic [t=(x))/se(x^)] with tn1(5%): if H1> tk=1(5%) we reject H0 and aceept H1, and if ftn1(5%) we fail to reject H0 at the 5% significance level. - For 1-sided H1:k>0 [or t t0(5%) we reject H0 and aceept H1, and if fShn(5%) we fail to reject H0 at the 5% significance level. - If a1 is isn't in the above 95% confidence interval for 1, then H0 (with 2 -sided H1 ) isn't is rejected. - For 1 -sided H1:1>1 [or 1 Step by Step Solution
There are 3 Steps involved in it
1 Expert Approved Answer
Step: 1 Unlock

Question Has Been Solved by an Expert!
Get step-by-step solutions from verified subject matter experts
Step: 2 Unlock
Step: 3 Unlock