

Question: only use the data, the problem is described in this picture ICA 17-20 Create a proper plot of the following set of experimental data collected
 only use the data, the problem is described in this picture
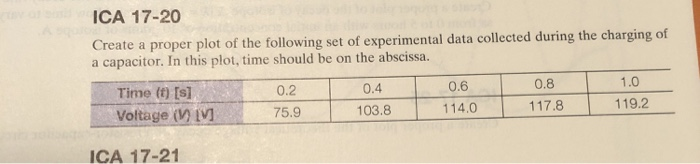
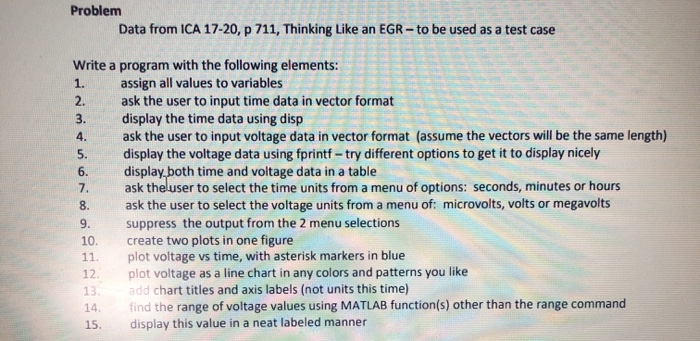
ICA 17-20 Create a proper plot of the following set of experimental data collected during the charging of a capacitor. In this plot, time should be on the abscissa. 0.2 Time (t) [s] Voltage ( VI 0.4 103.8 0.6 114,0 0.8 117.8 1.0 119.2 75.9 ICA 17-21 Problem Data from ICA 17-20, p 711, Thinking Like an EGR - to be used as a test case m =g ; Write a program with the following elements: assign all values to variables ask the user to input time data in vector format display the time data using disp ask the user to input voltage data in vector format (assume the vectors will be the same length) display the voltage data using fprintf-try different options to get it to display nicely display, both time and voltage data in a table ask theluser to select the time units from a menu of options: seconds, minutes or hours ask the user to select the voltage units from a menu of: microvolts, volts or megavolts suppress the output from the 2 menu selections create two plots in one figure plot voltage vs time, with asterisk markers in blue 12. plot voltage as a line chart in any colors and patterns you like add chart titles and axis labels (not units this time) 14. find the range of voltage values using MATLAB function(s) other than the range command 15. display this value in a neat labeled manner
Step by Step Solution
There are 3 Steps involved in it

Get step-by-step solutions from verified subject matter experts