

Question: Open an excel spreadsheet and enter the following data: Return on Return on Year Stock Z S&P 500 1 10% 5% 2 -15 -10 3
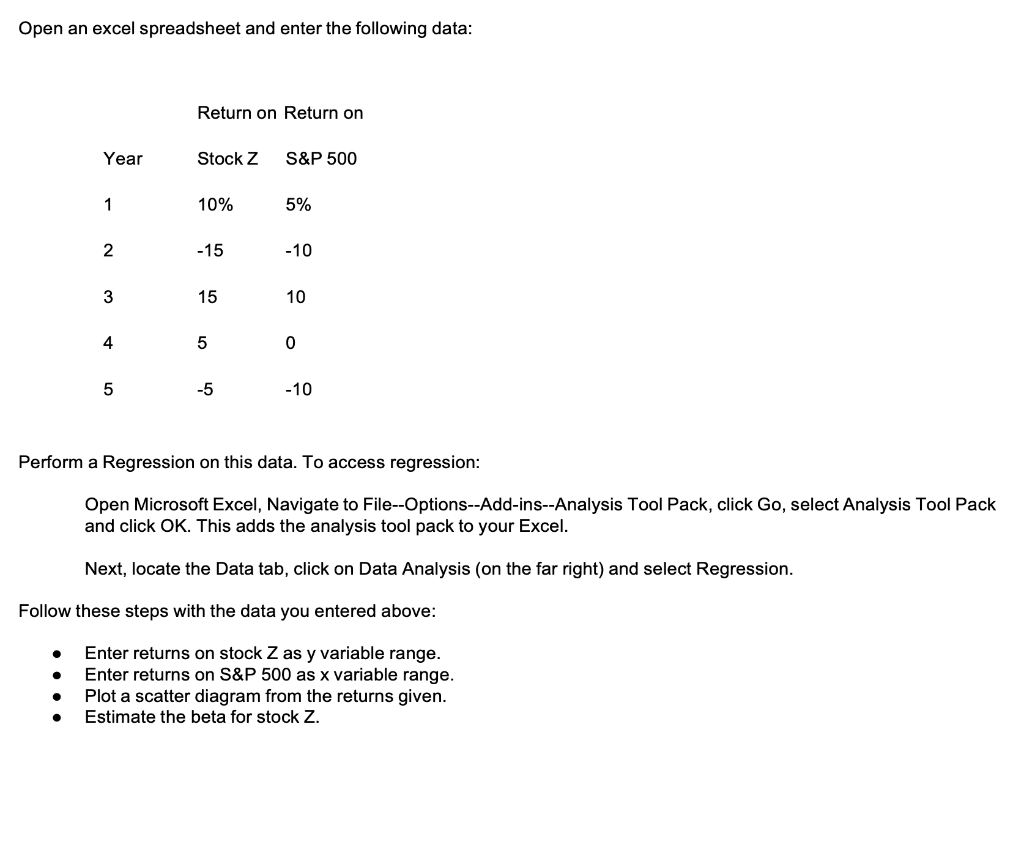
Open an excel spreadsheet and enter the following data: Return on Return on Year Stock Z S&P 500 1 10% 5% 2 -15 -10 3 15 10 4 5 0 5 -5 -10 Perform a Regression on this data. To access regression: Open Microsoft Excel, Navigate to File--Options--Add-ins--Analysis Tool Pack, click Go, select Analysis Tool Pack and click OK. This adds the analysis tool pack to your Excel. Next, locate the Data tab, click on Data Analysis (on the far right) and select Regression. Follow these steps with the data you entered above: Enter returns on stock Zas y variable range. Enter returns on S&P 500 as x variable range. Plot a scatter diagram from the returns given. Estimate the beta for stock Z
Step by Step Solution
There are 3 Steps involved in it

Get step-by-step solutions from verified subject matter experts