

Question: Open Assignment data file . . Sales transactions for the first 3 months of the year are in this file. This includes: Date: data of
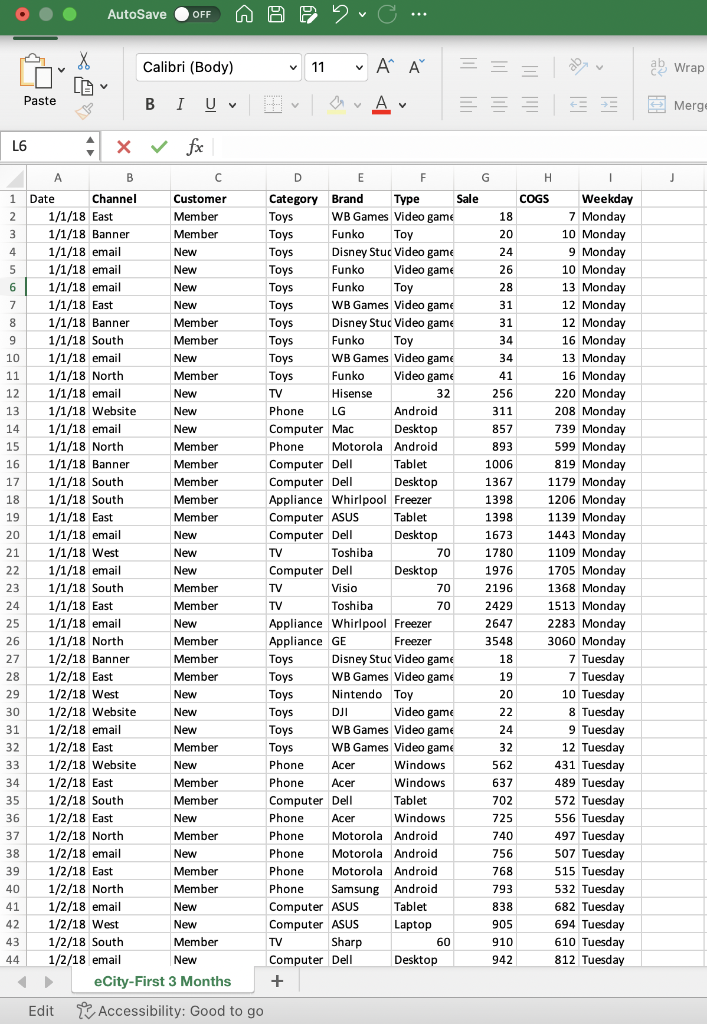
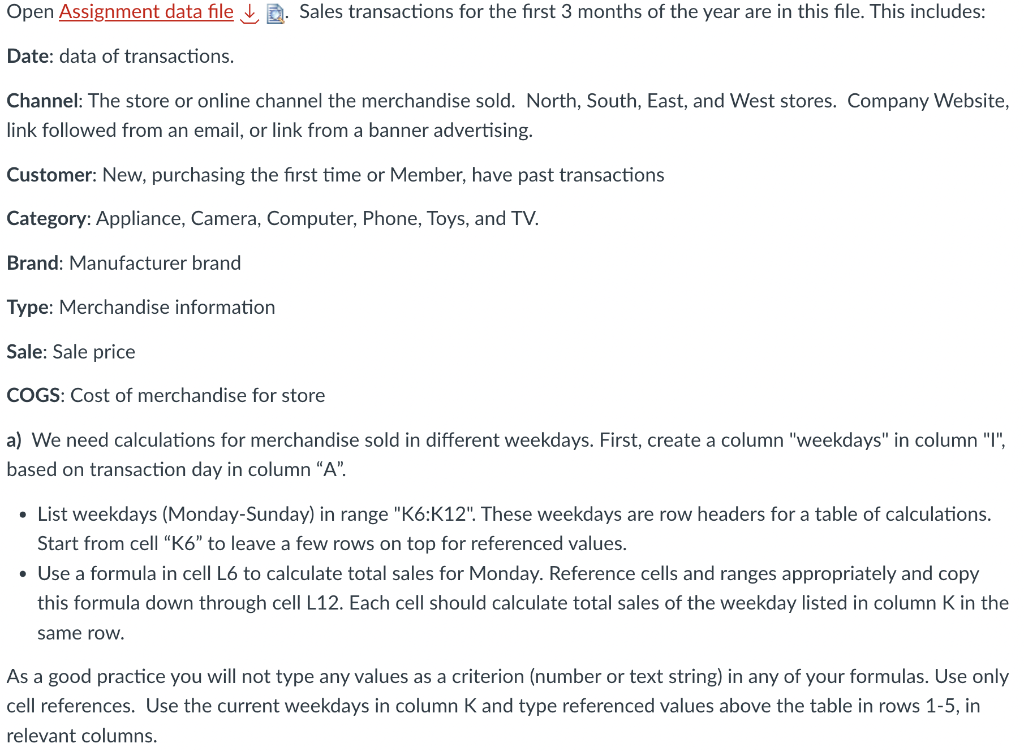
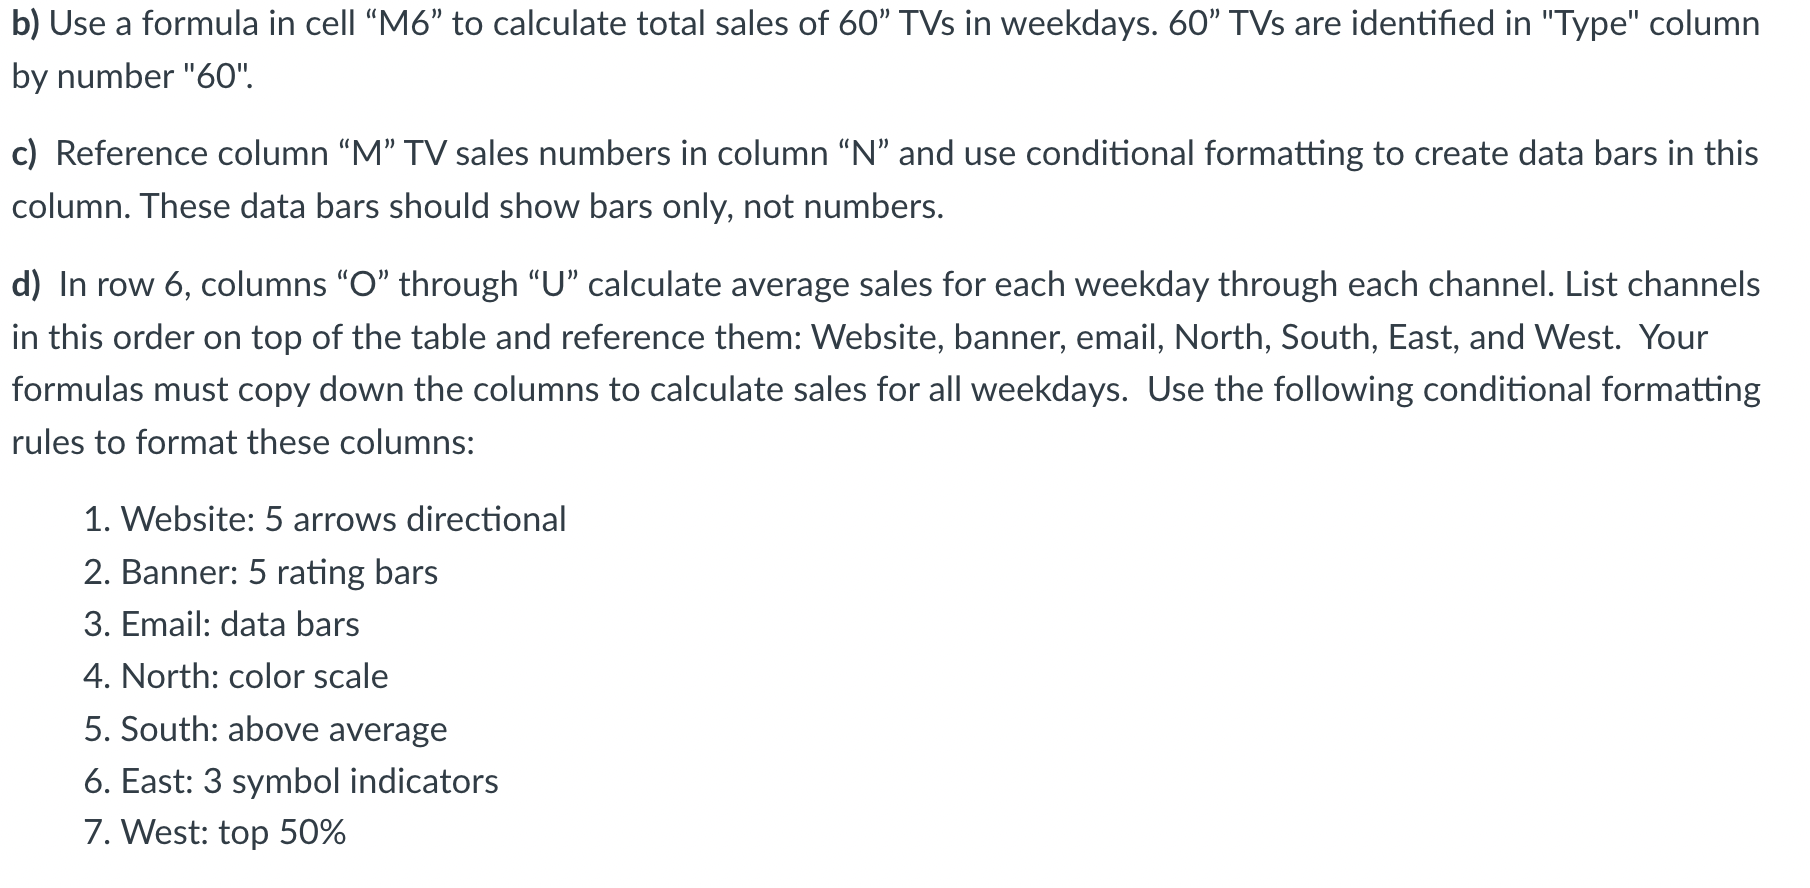
Open Assignment data file . . Sales transactions for the first 3 months of the year are in this file. This includes: Date: data of transactions. Channel: The store or online channel the merchandise sold. North, South, East, and West stores. Company Website, link followed from an email, or link from a banner advertising. Customer: New, purchasing the first time or Member, have past transactions Category: Appliance, Camera, Computer, Phone, Toys, and TV. Brand: Manufacturer brand Type: Merchandise information Sale: Sale price COGS: Cost of merchandise for store a) We need calculations for merchandise sold in different weekdays. First, create a column "weekdays" in column "I", based on transaction day in column " A ". - List weekdays (Monday-Sunday) in range "K6:K12". These weekdays are row headers for a table of calculations. Start from cell "K6" to leave a few rows on top for referenced values. - Use a formula in cell L6 to calculate total sales for Monday. Reference cells and ranges appropriately and copy this formula down through cell L12. Each cell should calculate total sales of the weekday listed in column K in the same row. As a good practice you will not type any values as a criterion (number or text string) in any of your formulas. Use only cell references. Use the current weekdays in column K and type referenced values above the table in rows 1-5, in relevant columns. b) Use a formula in cell M6" to calculate total sales of 60 TVs in weekdays. 60 TVs are identified in "Type" column by number "60". c) Reference column "M" TV sales numbers in column " N" and use conditional formatting to create data bars in this column. These data bars should show bars only, not numbers. d) In row 6, columns "O" through "U" calculate average sales for each weekday through each channel. List channels in this order on top of the table and reference them: Website, banner, email, North, South, East, and West. Your formulas must copy down the columns to calculate sales for all weekdays. Use the following conditional formatting rules to format these columns: 1. Website: 5 arrows directional 2. Banner: 5 rating bars 3. Email: data bars 4. North: color scale 5. South: above average 6. East: 3 symbol indicators 7. West: top 50% Open Assignment data file . . Sales transactions for the first 3 months of the year are in this file. This includes: Date: data of transactions. Channel: The store or online channel the merchandise sold. North, South, East, and West stores. Company Website, link followed from an email, or link from a banner advertising. Customer: New, purchasing the first time or Member, have past transactions Category: Appliance, Camera, Computer, Phone, Toys, and TV. Brand: Manufacturer brand Type: Merchandise information Sale: Sale price COGS: Cost of merchandise for store a) We need calculations for merchandise sold in different weekdays. First, create a column "weekdays" in column "I", based on transaction day in column " A ". - List weekdays (Monday-Sunday) in range "K6:K12". These weekdays are row headers for a table of calculations. Start from cell "K6" to leave a few rows on top for referenced values. - Use a formula in cell L6 to calculate total sales for Monday. Reference cells and ranges appropriately and copy this formula down through cell L12. Each cell should calculate total sales of the weekday listed in column K in the same row. As a good practice you will not type any values as a criterion (number or text string) in any of your formulas. Use only cell references. Use the current weekdays in column K and type referenced values above the table in rows 1-5, in relevant columns. b) Use a formula in cell M6" to calculate total sales of 60 TVs in weekdays. 60 TVs are identified in "Type" column by number "60". c) Reference column "M" TV sales numbers in column " N" and use conditional formatting to create data bars in this column. These data bars should show bars only, not numbers. d) In row 6, columns "O" through "U" calculate average sales for each weekday through each channel. List channels in this order on top of the table and reference them: Website, banner, email, North, South, East, and West. Your formulas must copy down the columns to calculate sales for all weekdays. Use the following conditional formatting rules to format these columns: 1. Website: 5 arrows directional 2. Banner: 5 rating bars 3. Email: data bars 4. North: color scale 5. South: above average 6. East: 3 symbol indicators 7. West: top 50%
Step by Step Solution
There are 3 Steps involved in it

Get step-by-step solutions from verified subject matter experts