

Question: Open spreadsheet a. Choose the correct time series plot for the data. A. B. The correct time series plot is What type of pattern exists
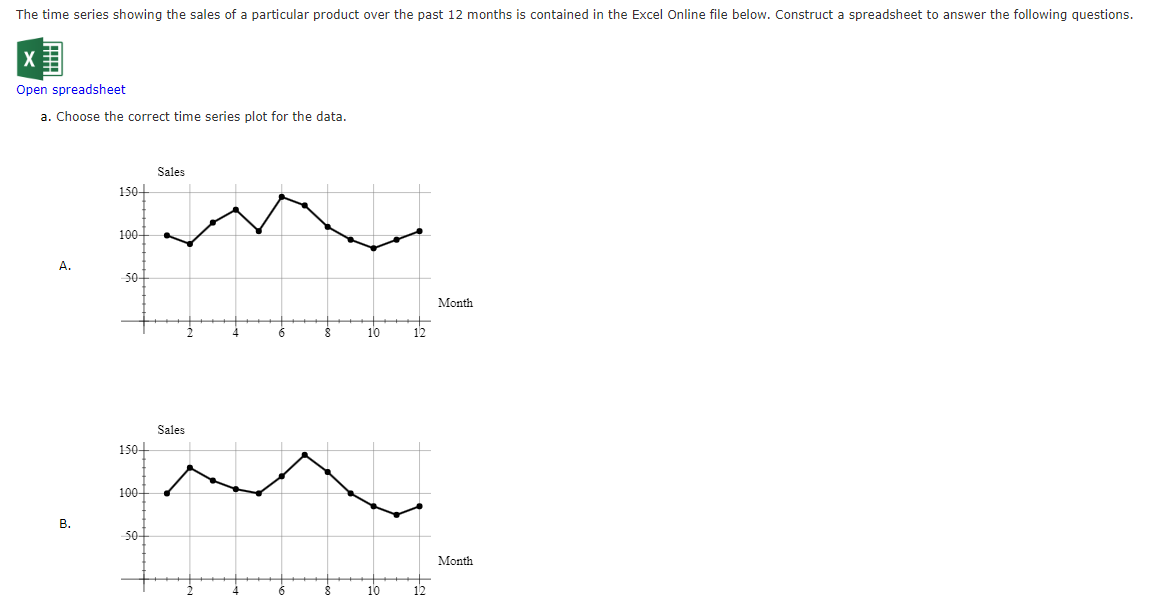
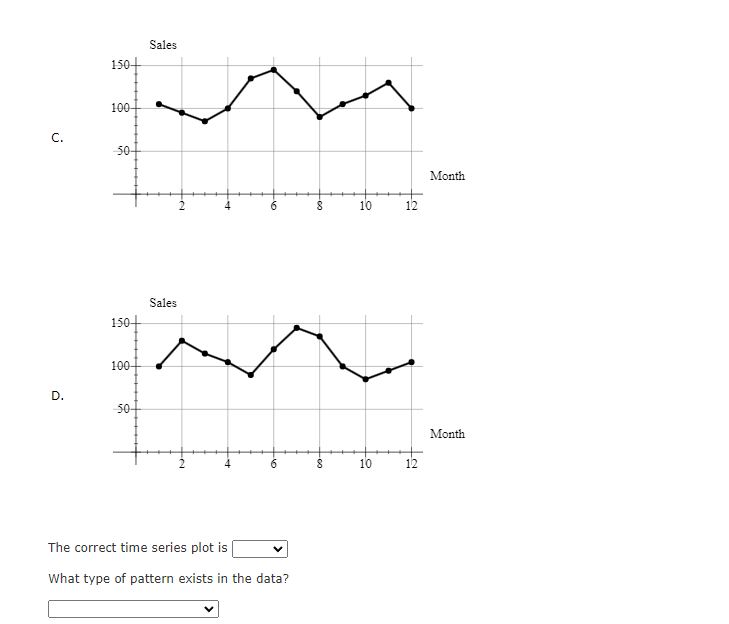
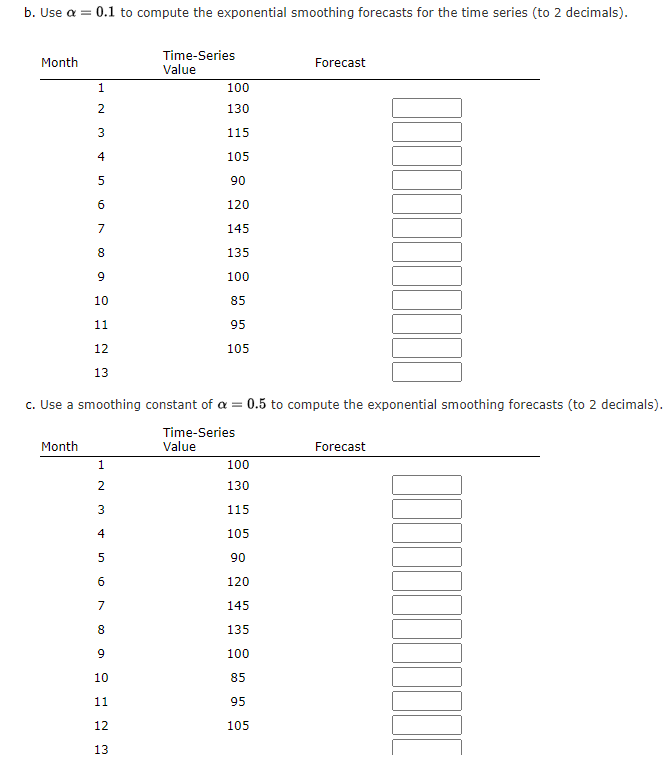
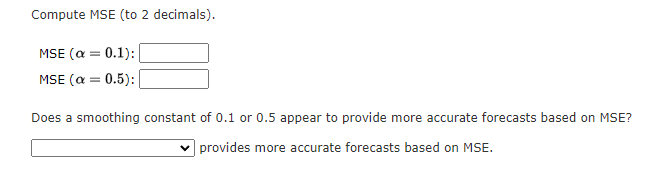
Open spreadsheet a. Choose the correct time series plot for the data. A. B. The correct time series plot is What type of pattern exists in the data? b. Use =0.1 to compute the exponential smoothing forecasts for the time series (to 2 decimals). c. Use a smoothing constant of =0.5 to compute the exponential smoothing forecasts (to 2 decimals). Compute MSE (to 2 decimals). MSE(=0.1)MSE(=0.5) Does a smoothing constant of 0.1 or 0.5 appear to provide more accurate forecasts based on MSE? provides more accurate forecasts based on MSE. Open spreadsheet a. Choose the correct time series plot for the data. A. B. The correct time series plot is What type of pattern exists in the data? b. Use =0.1 to compute the exponential smoothing forecasts for the time series (to 2 decimals). c. Use a smoothing constant of =0.5 to compute the exponential smoothing forecasts (to 2 decimals). Compute MSE (to 2 decimals). MSE(=0.1)MSE(=0.5) Does a smoothing constant of 0.1 or 0.5 appear to provide more accurate forecasts based on MSE? provides more accurate forecasts based on MSE
Step by Step Solution
There are 3 Steps involved in it

Get step-by-step solutions from verified subject matter experts