

Question: 1a. Choose the correct time series plot for the data. 1b. The correct time series plot is (choose one plot) plot A , plot B
1a. Choose the correct time series plot for the data.
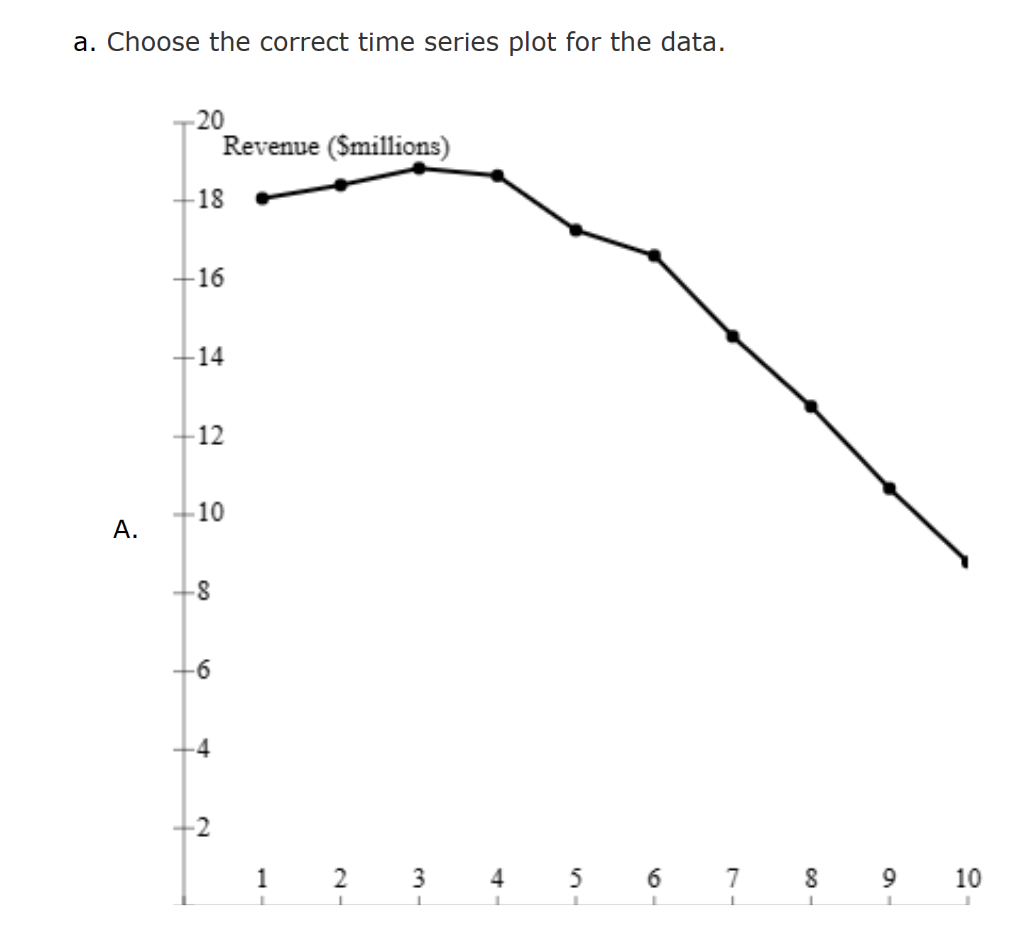
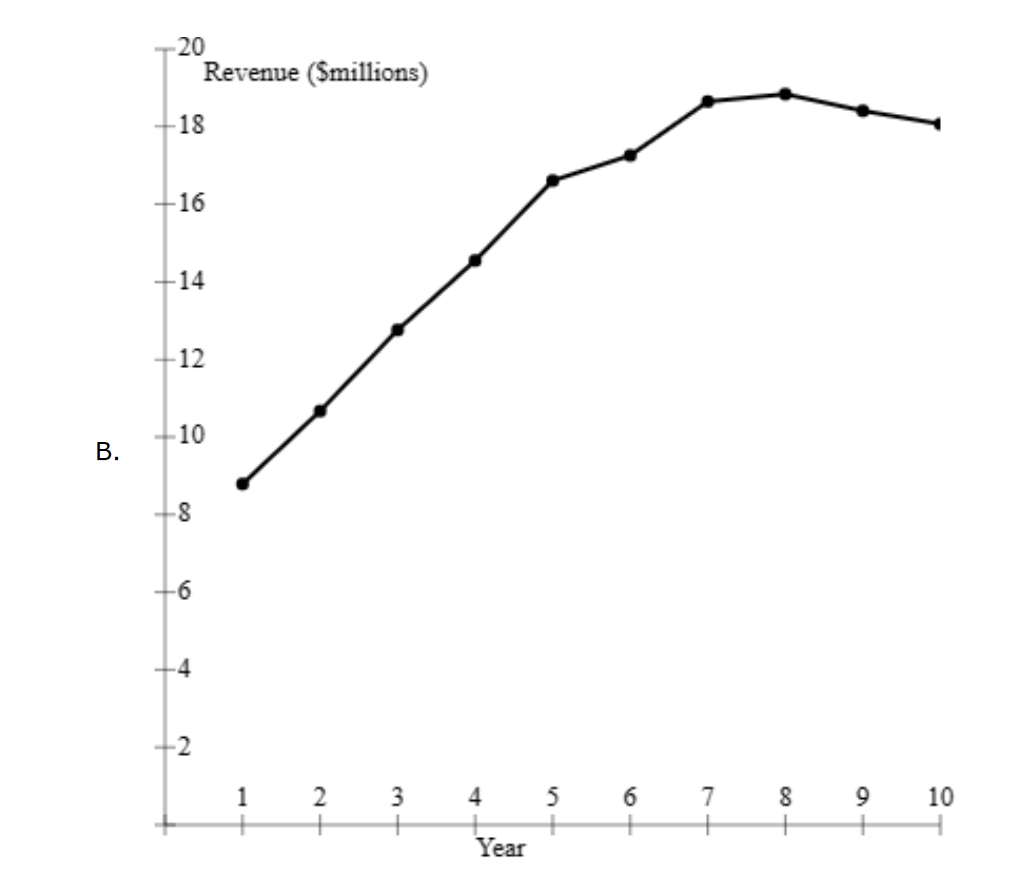
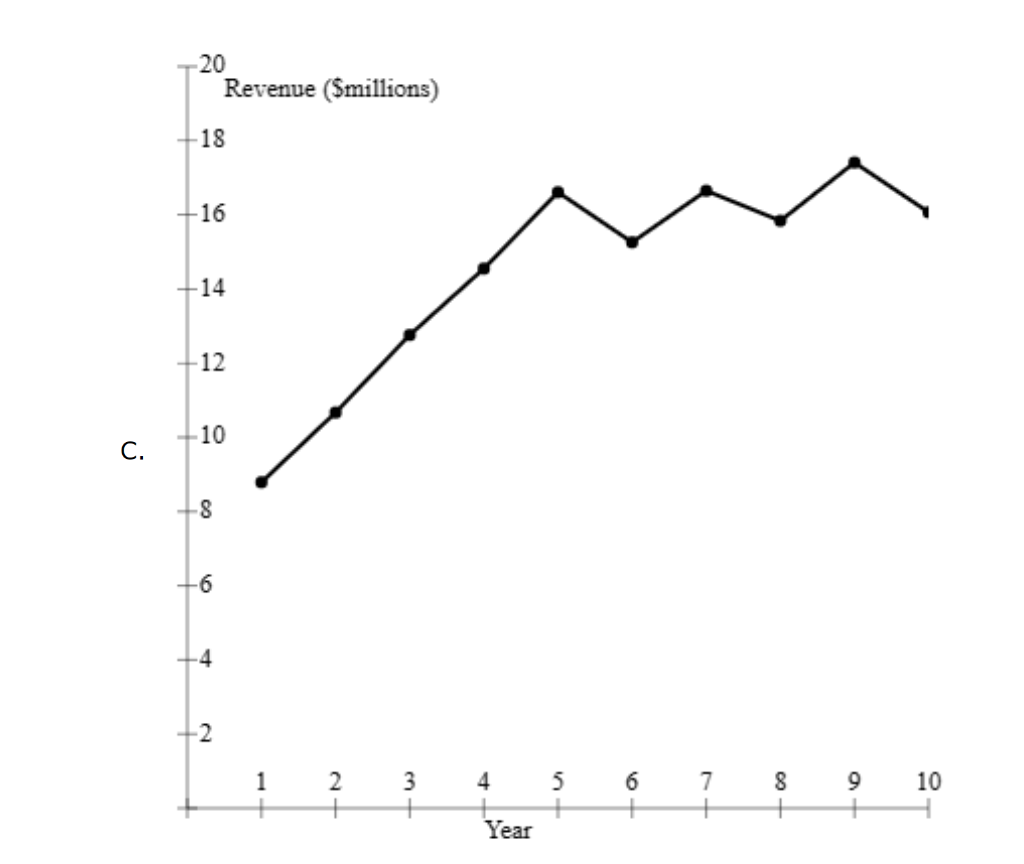
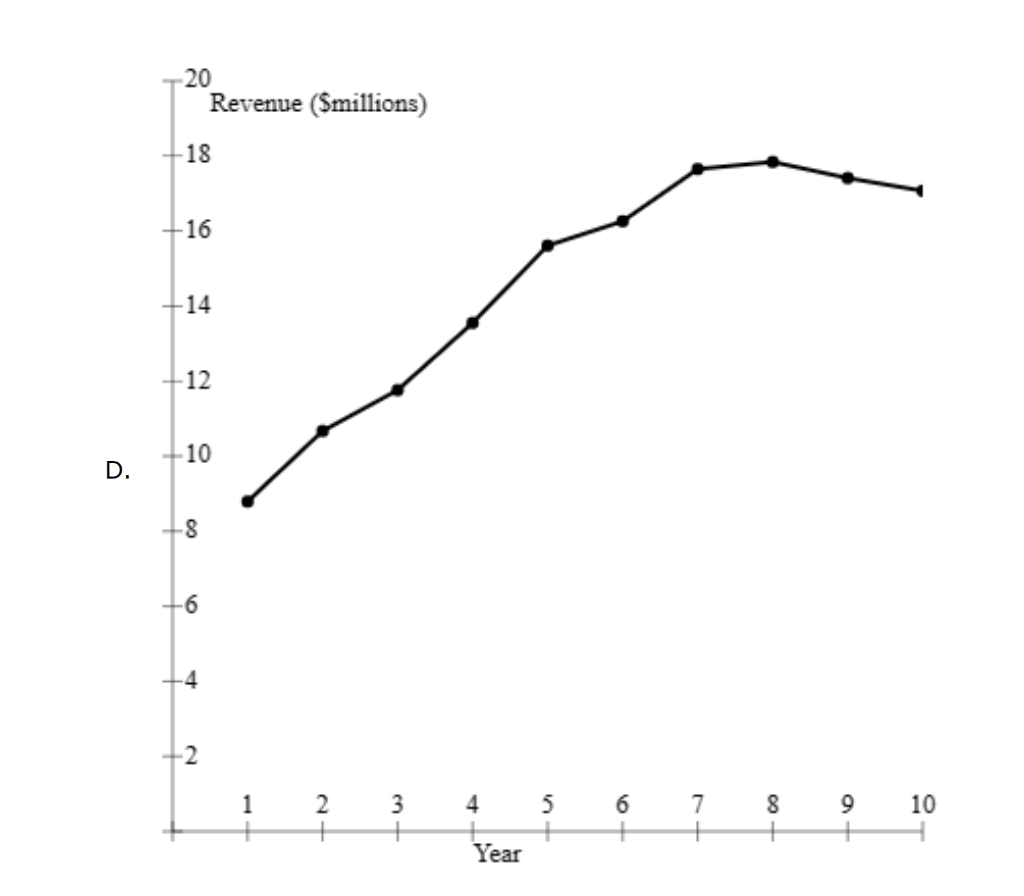
1b. The correct time series plot is (choose one plot)
plot A , plot B ,plot C ,plot D
1c. Comment on the appropriateness of a linear trend. ( choose one)
A linear trend is not appropriate , A linear trend appropriate
1d. fill in blanks
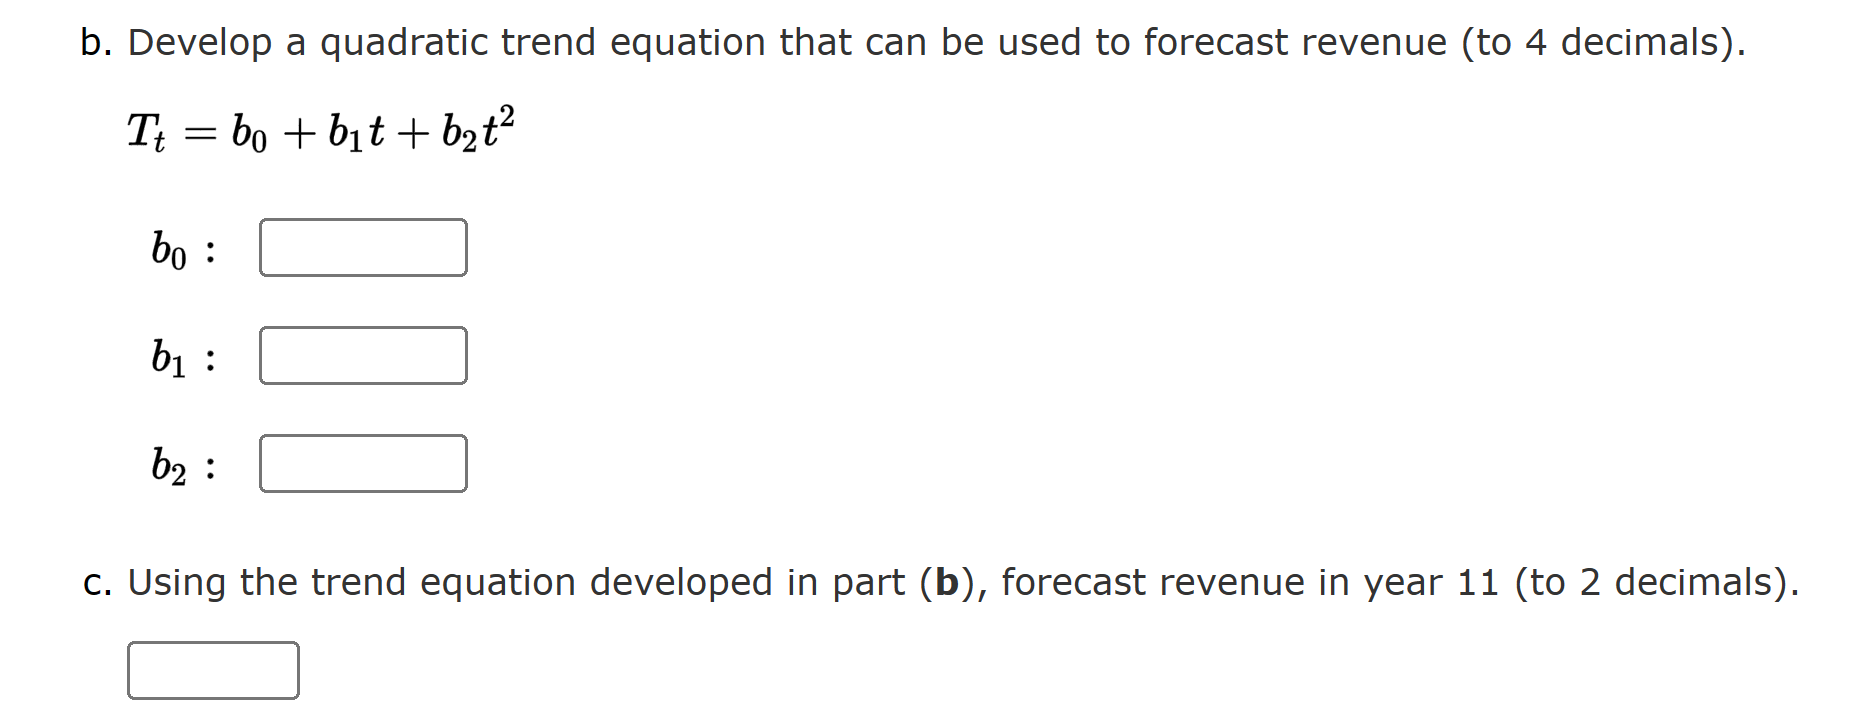
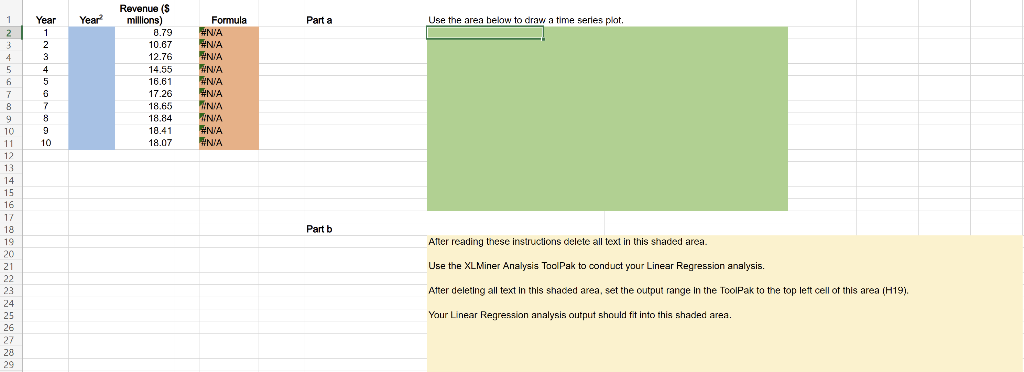
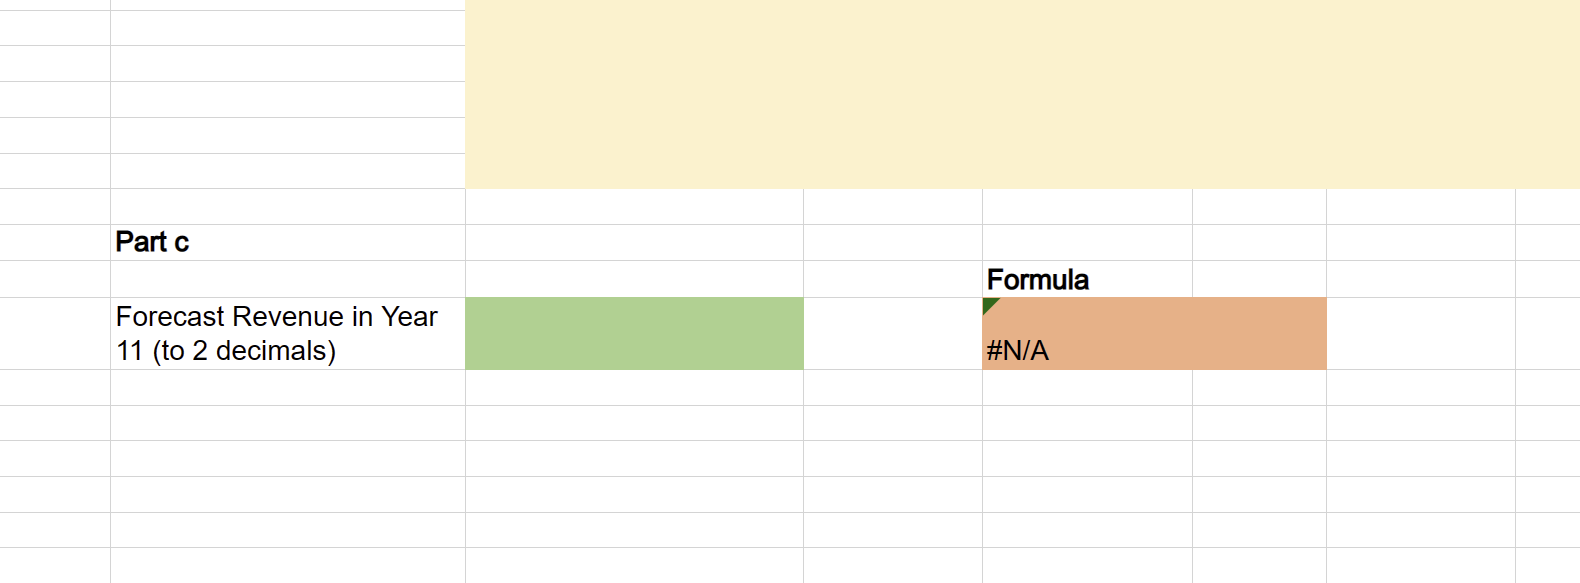
se the area helow to draw a time series plot. Iter reading these instructions clele all text in this shaded area. se the XLMiner Analysis ToolPak to conduct your Linear Regression analysis. Iter deleting all text in this shaded area, set the output range in the ToolPak to the top lett cell of this area iH19i. Jur Linear Regression analysis output should fit into this shaded area. Part c Formula Forecast Revenue in Year 11 (to 2 decimals) \#N/A a. Choose the correct time series plot for the data. b. Develop a quadratic trend equation that can be used to forecast revenue (to 4 decimals). Tt=b0+b1t+b2t2 b0: b1: b2: c. Using the trend equation developed in part (b), forecast revenue in year 11 (to 2 decimals)
Step by Step Solution
There are 3 Steps involved in it

Get step-by-step solutions from verified subject matter experts