

Question: Open the Customer Order Excel file in Tableau. Create a bubble chart with average Discount on the X-axis, average Profit on the Y-axis, and Average
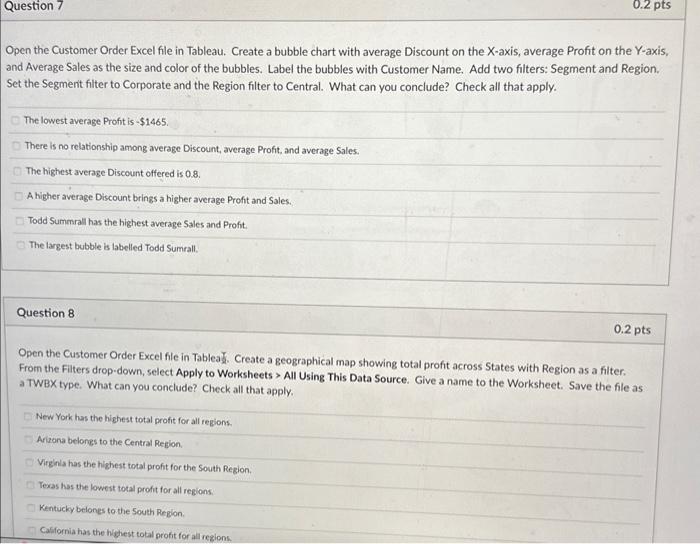
Open the Customer Order Excel file in Tableau. Create a bubble chart with average Discount on the X-axis, average Profit on the Y-axis, and Average Sales as the size and color of the bubbles. Label the bubbles with Customer Name. Add two filters: Segment and Region. Set the Segment filter to Corporate and the Region filter to Central. What can you conclude? Check all that apply. The lowest average Profit is $1465. There is no relationship among average Discount, average Profit, and average Sales. The highest average Discount offered is 0.8 . A higher average Discount brings a higher average Profit and Sales. Todd Summrall has the highest average Sales and Profit. The largest bubble is labelled Todd Sumrall. Question 8 0.2pts Open the Customer Order Excel file in Tablea .. Create a geographical map showing total profit across States with Region as a filter. From the Filters drop-down, select Apply to Worksheets > All Using This Data Source. Give a name to the Worksheet. Save the file as a TWBX type. What can you conclude? Check all that apply. New York has the highest total profit for all regions. Arizana belongs to the Central Region. Virginla has the highest total profit for the South Region. Texas has the lowest total profit for all regions. Kentucky belones to the South Region. Casfornia has the highest total profit for all rezions
Step by Step Solution
There are 3 Steps involved in it

Get step-by-step solutions from verified subject matter experts