

Question: Open with MAP4C FINAL ASSIGNMENT Aptitude Final Test Score Mathematics a) Make a scatter plot of the data using Google she Mark Attach a screenshot.
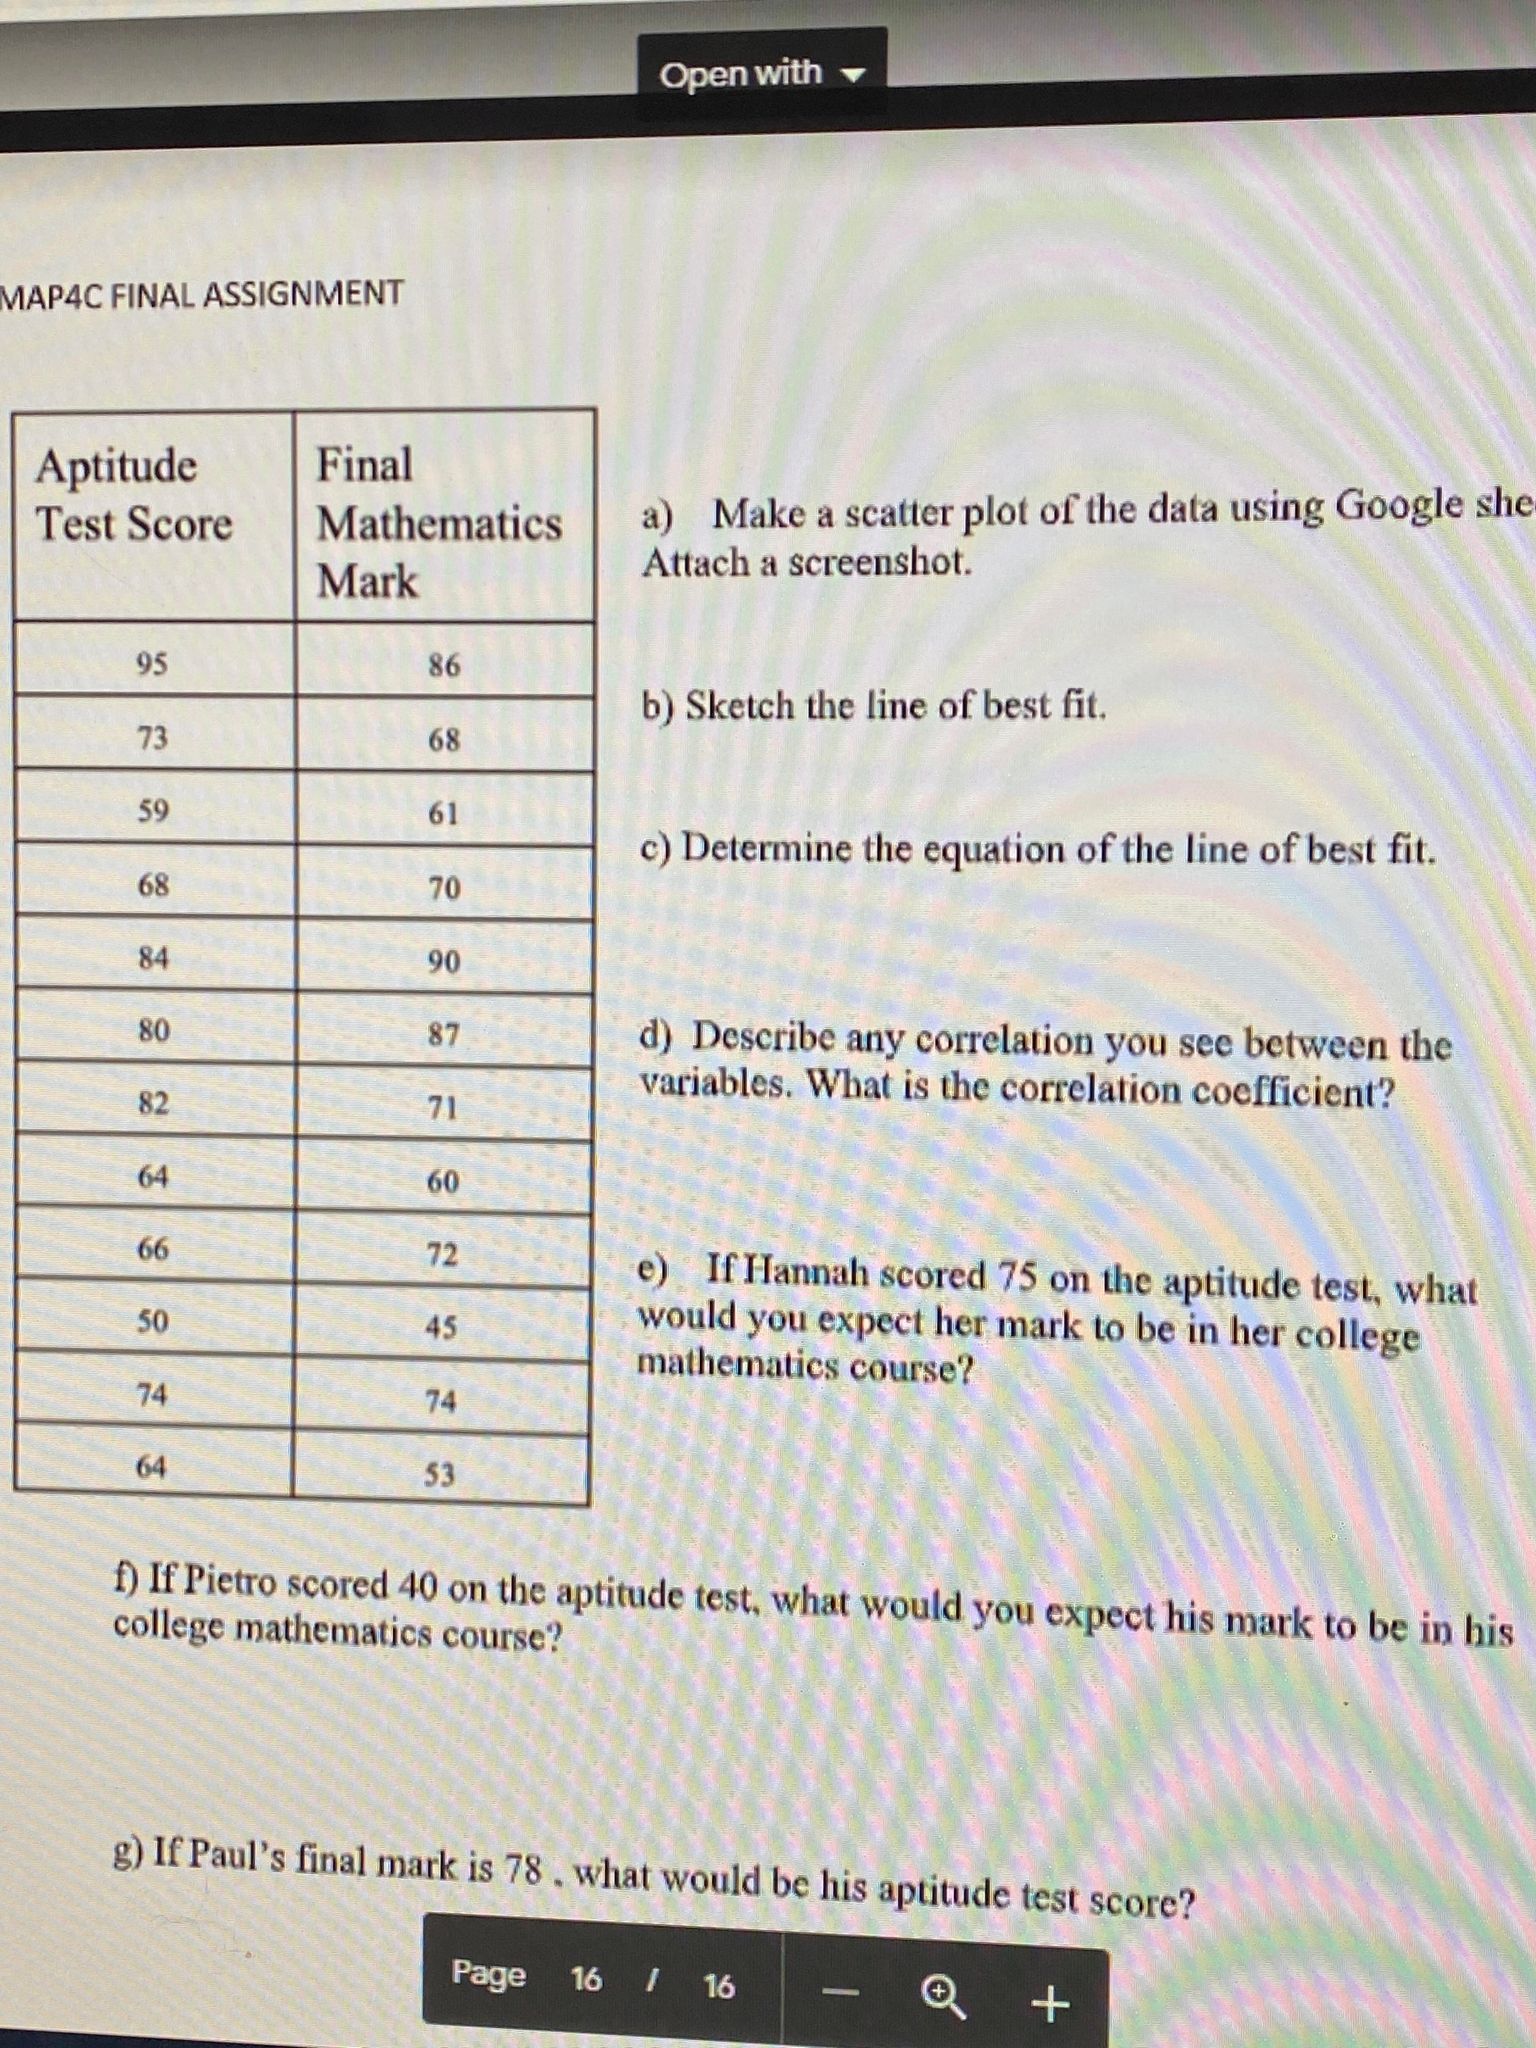
Open with MAP4C FINAL ASSIGNMENT Aptitude Final Test Score Mathematics a) Make a scatter plot of the data using Google she Mark Attach a screenshot. 95 86 b) Sketch the line of best fit. 73 68 59 61 c) Determine the equation of the line of best fit. 68 70 84 90 80 87 d) Describe any correlation you see between the 82 71 variables. What is the correlation coefficient? 64 60 66 72 e) If Hannah scored 75 on the aptitude test, what 50 45 would you expect her mark to be in her college mathematics course? 74 74 64 53 f) If Pietro scored 40 on the aptitude test, what would you expect his mark to be in his college mathematics course? g) If Paul's final mark is 78 . what would be his aptitude test score? Page 16 / 16 +
Step by Step Solution
There are 3 Steps involved in it

Get step-by-step solutions from verified subject matter experts