

Question: Operating data for Bridgeport Corp. are presented below 2017 2016 $641,300 Sales revenue $826,200 523,300 414,500 Cost of goods sold 78,500 Selling expenses 121,800 77,100
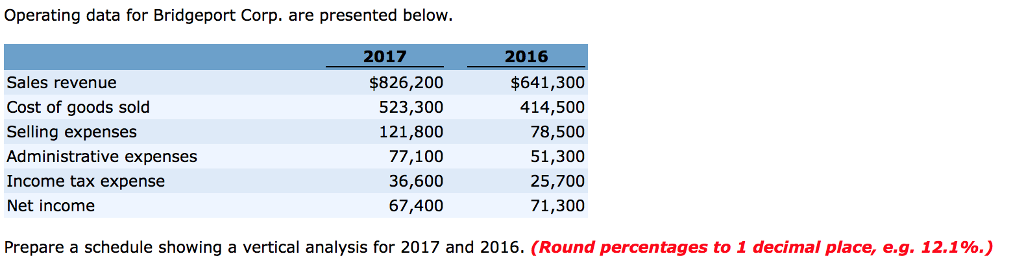
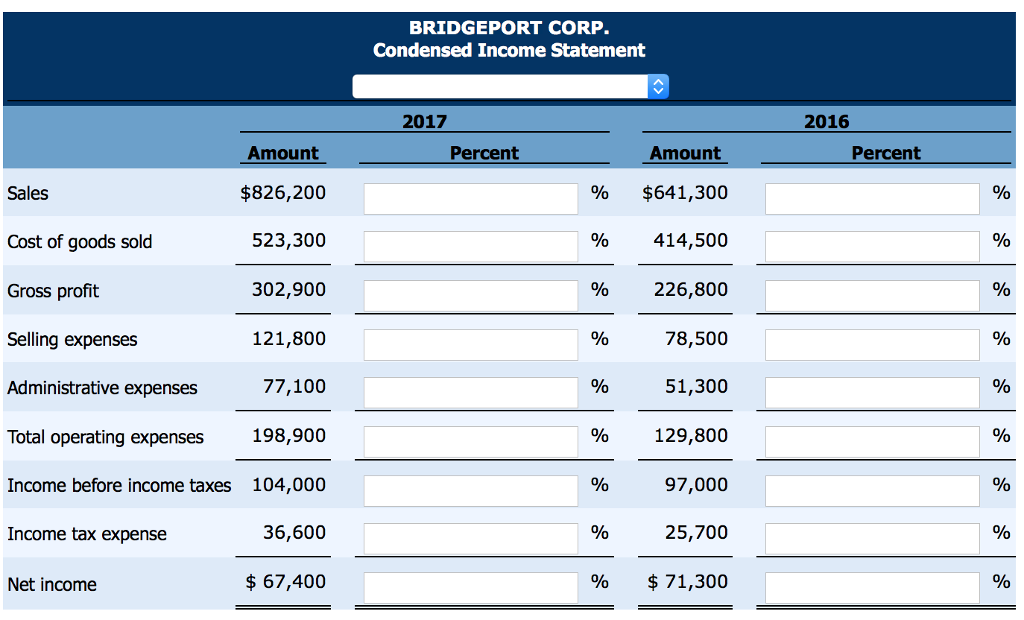
Operating data for Bridgeport Corp. are presented below 2017 2016 $641,300 Sales revenue $826,200 523,300 414,500 Cost of goods sold 78,500 Selling expenses 121,800 77,100 51,300 Administrative expenses Income tax expense 36,600 25,700 71,300 67,400 Net income Prepare a schedule showing a vertical analysis for 2017 and 2016. (Round percentages to 1 decimal place, e.g. 12.1%.)
Step by Step Solution
There are 3 Steps involved in it
1 Expert Approved Answer
Step: 1 Unlock

Question Has Been Solved by an Expert!
Get step-by-step solutions from verified subject matter experts
Step: 2 Unlock
Step: 3 Unlock