

Question: Operating data for Grouper Corp. are presented below. 2012 2016 $842800 645,500 29,300 411200 124,400 79,500 Administrative expenses79.500 50.100 36.000 27,500 73600 77.200 Sales revenue
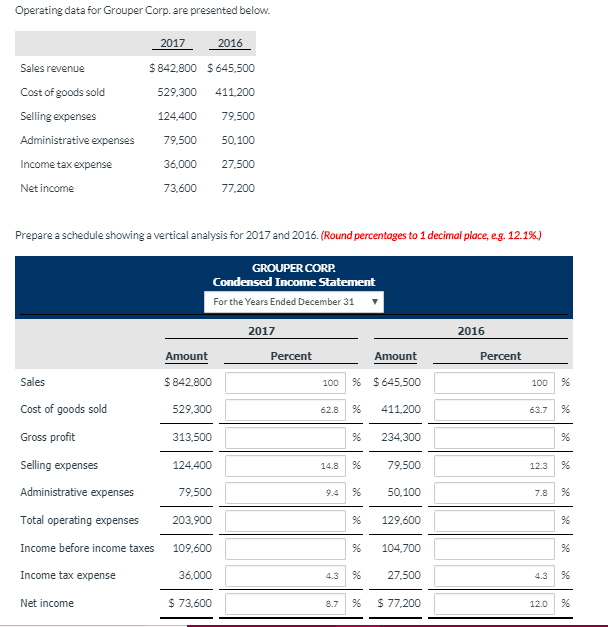
Operating data for Grouper Corp. are presented below. 2012 2016 $842800 645,500 29,300 411200 124,400 79,500 Administrative expenses79.500 50.100 36.000 27,500 73600 77.200 Sales revenue Cost of goods sold Selling expenses Income tax expense Net income Prepare a schedule showing a vertical analysis for 2017 and 2016. (Round percentages to 1 decimal place, eg, 12.1%) GROUPER CORP For the Years Ended December 31 2017 2016 Amount $842800 529,300 313,500 124,400 79,500 203,900 109,600 36,000 $73.600 Percent Amount 100 % $645,500 62.8 % 411.200 % 234.300 14.8 % 79,500 9.4 | % 50.100 % 129,600 % 104.700 43196 27.500 8.71% $77.200 Percent Sales Cost of goods sold Gross proft Selling expenses 100 96 63.7 Total operating expenses Income before income taxes Income tax expense Net income 12.3 | 96 7.8 | 96 9% 9% 431% 12.01 %
Step by Step Solution
There are 3 Steps involved in it

Get step-by-step solutions from verified subject matter experts