

Question: Operating data for Grouper Corp. are presented below. 2017 2016 Sales revenue Cost of goods sold Selling expenses Administrative expenses Income tax expense Net income
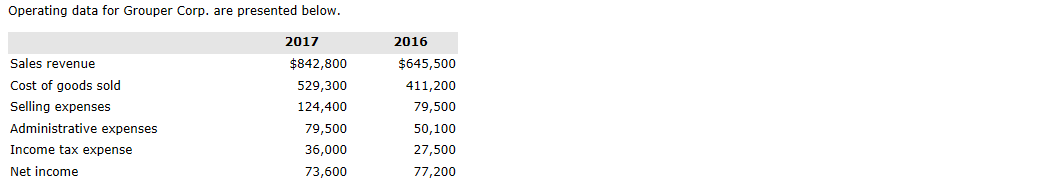
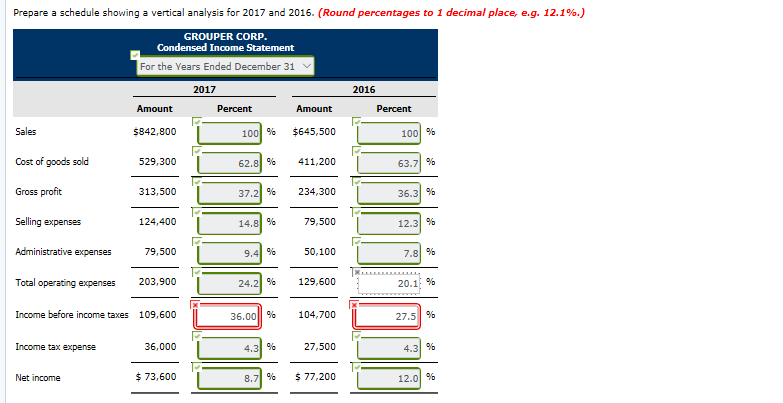
Operating data for Grouper Corp. are presented below. 2017 2016 Sales revenue Cost of goods sold Selling expenses Administrative expenses Income tax expense Net income $842,800 529,300 124,400 79,500 36,000 73,600 $645,500 411,200 79,500 50,100 27,500 77,200 Prepare a schedule showing a vertical analysis for 2017 and 2016. (Round percentages to 1 decimal place, e.g. 12.1%.) GROUPER CORP. Condensed Income Statement For the Years Ended December 31 2017 2016 Amount Percent Amount Percent Sales 5842,800 100 % $645,500 1001 96 Cost of goods sold 529,300 62.8% 411,200 63.71 96 Gross profit 313,500 37.21 % 234,300 36.3 % Selling expenses 124,400 14.8 %6 79,500 12.31 % Administrative expenses 79,500 9.41 % 50,100 7.896 Total operating expenses 203,900 24.21% 129,600 20.1 % Income before income taxes 109,600 36.00ll % 104,700 27.5% Income tax expense 36,000 4.31% 27.500 4.31 96 Net income $ 73,600 8.71 % $ 77,200 12.0l 96
Step by Step Solution
There are 3 Steps involved in it

Get step-by-step solutions from verified subject matter experts