

Question: operation research Solve LPP using Graphical method Using the following link solve the given LPP and find the optimal solution. Take the screenshot of the
operation research 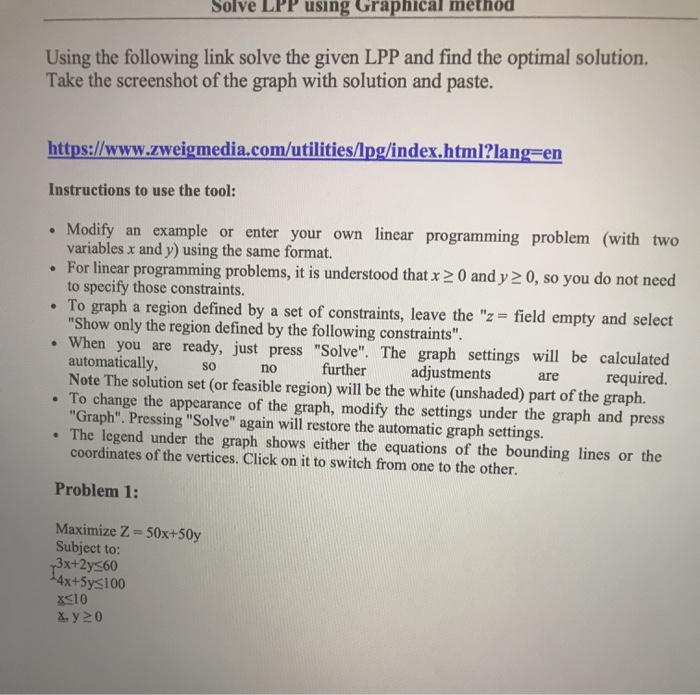
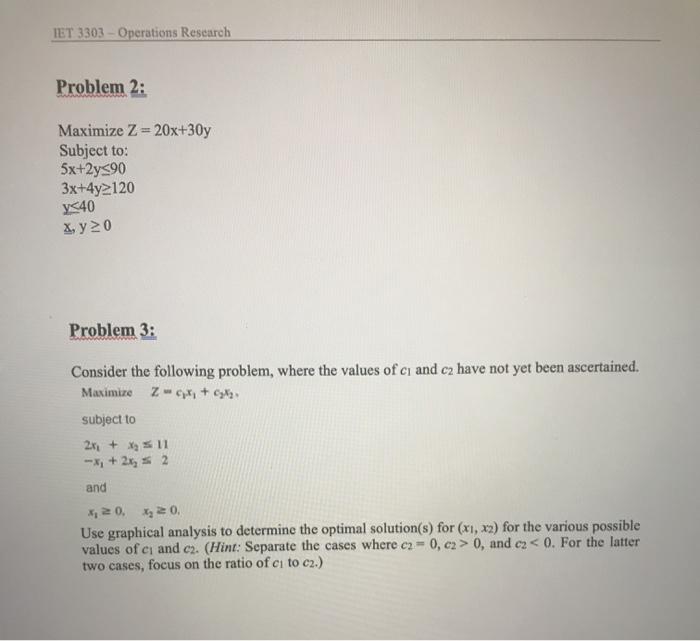
Solve LPP using Graphical method Using the following link solve the given LPP and find the optimal solution. Take the screenshot of the graph with solution and paste. https://www.zweigmedia.com/utilities/1pg/index.html?lang=en Instructions to use the tool: . Modify an example or enter your own linear programming problem (with two variables x and y) using the same format. For linear programming problems, it is understood that x > 0 and y> 0, so you do not need to specify those constraints. To graph a region defined by a set of constraints, leave the "z = field empty and select "Show only the region defined by the following constraints". When you are ready, just press "Solve". The graph settings will be calculated automatically, further adjustments are required. Note The solution set (or feasible region) will be the white (unshaded) part of the graph. To change the appearance of the graph, modify the settings under the graph and press "Graph". Pressing "Solve" again will restore the automatic graph settings. The legend under the graph shows either the equations of the bounding lines or the coordinates of the vertices. Click on it to switch from one to the other. SO no Problem 1: Maximize Z = 50x+50y Subject to: 3x+2y=60 4x+3y=100 X510 X. y20 IET 3303 - Operations Research Problem 2: Maximize Z=20x+30y Subject to: 5x+2y=90 3x+4y 120 y 0, and ez Step by Step Solution
There are 3 Steps involved in it
1 Expert Approved Answer
Step: 1 Unlock

Question Has Been Solved by an Expert!
Get step-by-step solutions from verified subject matter experts
Step: 2 Unlock
Step: 3 Unlock