

Question: Operation Supply chain Mngmt i need help finding the forecast for week 13 (exponenrial smoothinv forecast) also NEED MAD & MAPE for the exponential smoothing
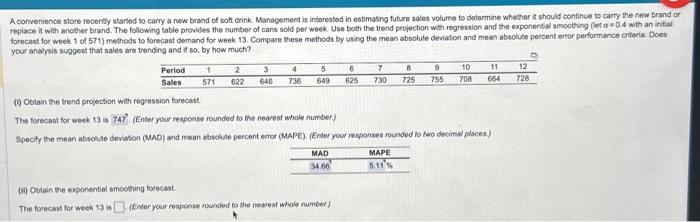
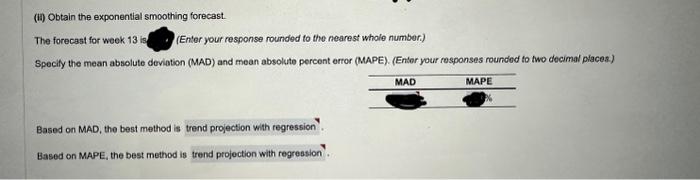
A convenience store recently started to carry a new brand of soft crink. Managoment is interested in estimasng future sales volume to determine whether it should continue to carry the new brand or replace it with another brand. The following table provides the number of cans sold per week. Use both the trend projection with regression and the exponential smoothing (fet =0.4 with an initial forecast for week 1 of 571 ) methods to forecast demand for week 13. Compare these methods by using the mean absolute deviation and mean absolute porcent error performance criteria. Oces your anolysis suggest that sales are trending and if so, by how much? (0) Obtain the trend projection with regression forecast The forecast for week 13 is 747. (Enter your response rounded to the nearest whole number) Specify the mean absolule deviston (MAD) and mean absolile percent error (MAPE). (Enter your responses rounded to two decima ploces) (ii) Oetain the exponential smoothing forecast. The forecast for moek 13 is (Entar your respense counded to the noseat whole number) (i) Obtain the exponential smoothing forecast. The forecast for week 13 is (Enter your response rounded to the nearest whole number.) Specily the mean absolute deviation (MAD) and mean absolute percent error (MAPE). (Enter your responses rounded to two decimal places.) Based on MAD, the best method is Based on MAPE, the best method is
Step by Step Solution
There are 3 Steps involved in it

Get step-by-step solutions from verified subject matter experts