

Question: Operations Management The attached data set is an Excel file with three spreadsheets (Sales data.xlsx). The Excel file contains sales, pricing and distribution figures of
Operations Management
The attached data set is an Excel file with three spreadsheets (Sales data.xlsx). The Excel file contains sales, pricing and distribution figures of the different variants of a particular product for a full year.
The spreadsheets each contain different data, as described as below:
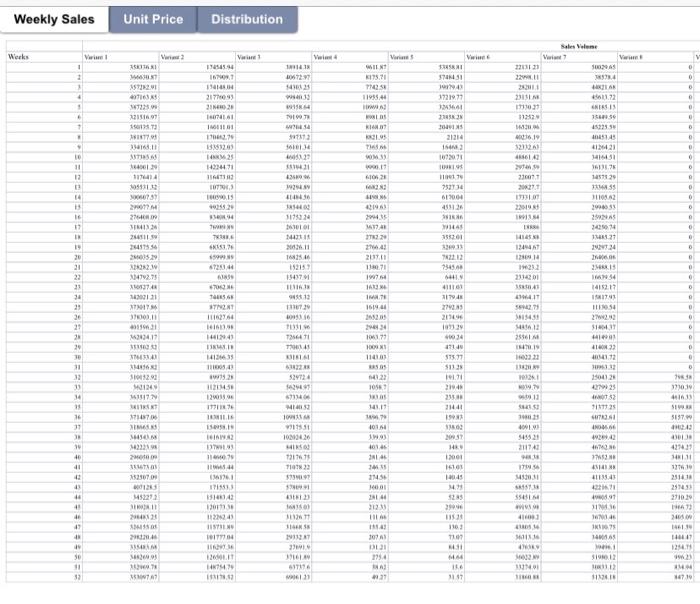
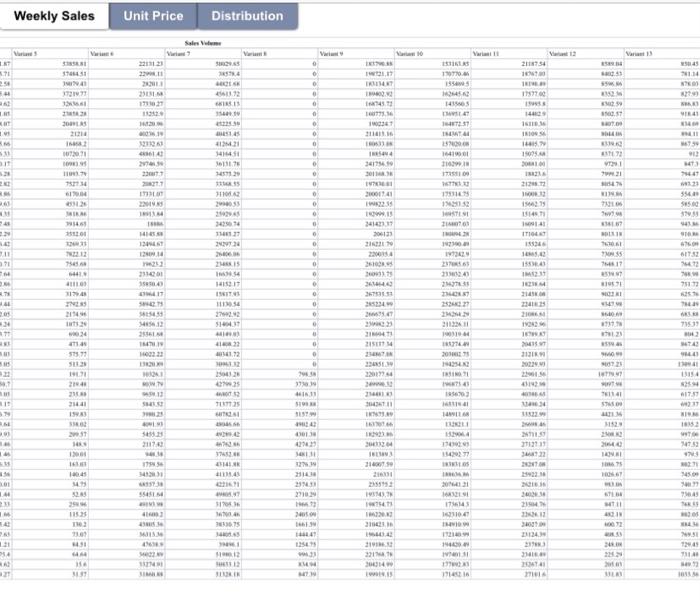
a. Weekly Sales (Spreadsheet 1). This contains weekly sales figures for 13 different variants of the same product from a particular supermarket chain. There are total 52 weeks of data, that is, one full year of sales. The sales figures are in number of units sold.
b. Unit Price (Spreadsheet 2). This contains the average unit price charged per variant per week for all 13 variants. The figures are in average prices in pence. So a 100 implies 1.
c. Distribution (Spreadsheet 3). This contains the percentage of stores of the supermarket chain that stored each product variant in its shelves per week. A 100 for a particular variant for a given week meant that this supermarket listed this product on its shelves in all its stores that week.
Use this data set to answer the following questions.
You are free to use any statistical software of your choice. Whichever software you use, its name and version should be clearly indicated at the beginning of your report. All figures and tables need to be clearly labelled. Please note that some marks are allocated for visual clarity and ease of interpretation of the tables and figures.
Question 1 (20)
a. Provide a visual representation of the volume of sales for all variants across all weeks. Also provide the summary statistic of the sales volume of each of the variants. The summary statistics should contain a measures of representative sales and measures of spread. (10)
Hint: Line charts with sales trajectories of all product variants should be presented separately. The summary statistics should provide the mean, median, standard deviation, min and max of the sales values for each of the 13 variants.
b. Identify the top 4 selling variants among the 13 in the data. Explain your answer and illustrate your answer using a pie chart. (10)
.
Question 2 (40)
a. Provide a correlation table indicating overall relationships between the various prices. (10)
b. Can you identify those variants, whose prices match each other relatively closely. Explain
using the correlation table. Please propose methods for detecting and solving multicollinearity
(10)
c. Conduct an exploratory factor analysis of distribution variants and generate an aggregated
index. Please present results in tables. (20)
Question 3 (40)
a. Using the multivariate regression methodology, can you identify which prices directly affect the sales of Variant 2? (20)
b. Interpret the regression results and discuss the model explanation power (20)
Below is the individual data set to use

Operations Management
The attached data set is an Excel file with three spreadsheets (Sales data.xlsx). The Excel file contains sales, pricing and distribution figures of the different variants of a particular product for a full year.
The spreadsheets each contain different data, as described as below:
a. Weekly Sales (Spreadsheet 1). This contains weekly sales figures for 13 different variants of the same product from a particular supermarket chain. There are total 52 weeks of data, that is, one full year of sales. The sales figures are in number of units sold.
b. Unit Price (Spreadsheet 2). This contains the average unit price charged per variant per week for all 13 variants. The figures are in average prices in pence. So a 100 implies 1.
c. Distribution (Spreadsheet 3). This contains the percentage of stores of the supermarket chain that stored each product variant in its shelves per week. A 100 for a particular variant for a given week meant that this supermarket listed this product on its shelves in all its stores that week.
Use this data set to answer the following questions.
You are free to use any statistical software of your choice. Whichever software you use, its name and version should be clearly indicated at the beginning of your report. All figures and tables need to be clearly labelled. Please note that some marks are allocated for visual clarity and ease of interpretation of the tables and figures.
Question 1 (20)
a. Provide a visual representation of the volume of sales for all variants across all weeks. Also provide the summary statistic of the sales volume of each of the variants. The summary statistics should contain a measures of representative sales and measures of spread. (10)
Hint: Line charts with sales trajectories of all product variants should be presented separately. The summary statistics should provide the mean, median, standard deviation, min and max of the sales values for each of the 13 variants.
b. Identify the top 4 selling variants among the 13 in the data. Explain your answer and illustrate your answer using a pie chart. (10)
.
Question 2 (40)
a. Provide a correlation table indicating overall relationships between the various prices. (10)
b. Can you identify those variants, whose prices match each other relatively closely. Explain
using the correlation table. Please propose methods for detecting and solving multicollinearity
(10)
c. Conduct an exploratory factor analysis of distribution variants and generate an aggregated
index. Please present results in tables. (20)
Question 3 (40)
a. Using the multivariate regression methodology, can you identify which prices directly affect the sales of Variant 2? (20)
b. Interpret the regression results and discuss the model explanation power (20)
Below is the individual data set to use
Please help me solve this business analytics question
My stats
Today
CF Score:N/A
Answered:3
Skipped:0
Please help me solve this business analytics question
My stats
Today
CF Score:N/A
Answered:3
Skipped:0
Weekly Sales Unit Price Distribution Sales Vene Werks Vw V Varis V Vw 151 NE TIENE EN 119 SAS 0 V1 154 1790 134140 21770 2013 22 ISTI 1 2 1 4 1 0 ISNIS F FECER w 0 2.1 163 21 TS 119354 4 1221977 1062 149629 3 14 900 T w 112 I WICE LOLLI 11122 ENTRS CONNIE 0 LOISID 11212 OSE I NEVE SK ESTE PIZIE 114.3 0 1 . FLETU 11 11 111111 12. 18120 M25 14224471 16.19 122 0 10 PI LE IM 16 1022021 TV EF 1917 TM WM 11 6106 4130421 141631 161 0 ANTIS UN 1444 51113 O 8 43 SESSTE CHILLI CH LI 732730 TUT 19 2552 MEME IT ENE NET ( 2007.1 2011 1931 1485 11102 0 0 19 HL 45136 27600 117324 IWW 16 17 0 NAS 2014 WIRE 2015 1414 IT IMPER TWINS THE 11. 0 10 SEN 1 STIR 35301 LEWE 2015 TYLE 234 0 SS 72113 0 IN 19 20 21 22 23 30 6724 1349 1201 1921 311420 SIWE WCZNIK SLEACH 0 2011 11 19 JA SHS 111 0374 700 TA START 2001 165.44 15215 154371 1111 1113 T.39 2016 1011 T2664 145 4111 IVA ESE LIHAT 234 14112.17 1911 ICICIL 0 0 CELE ISTII MT2017 011 19.629111 0 0 181843 29 36 21 28 IC LI 16 31 24 0173 FOOD HA 1441 0 2015 189 034 7140 57577 2722 51404.37 44100 213411 TIV w 1955 SI NE INI TEORI 0 IVINI 1140 0 WIL SER SETS 11 11 13 11 4322 52472 31021 14123 11100 12 2013 1201 177127 123 105 4014112 11 150412 427925 52 SPIN LC 14 1411 713400 1. 2194 23 21441 1991 STRE TERE 11 LI CERI 11 SELLE ES HE 30:19 4113 SIWA 31970 43 16 1214700 102 15 SILA COM 40 LL HE 150 LINA wa 1015 19 401 OP PWP LV 19 VER SH 211741 421431 HINO 721745 40 11 2 TEN 23070 IP 44 VINE NE NE CEREDEL LOS 12001 16101 10.45 ILE DELL 467 773 41 4112345 2221 TUN 45031 25141 SESSI HER TES 43 44 NI CEESH $25 SI 10142 10 2014 31 333 10) 11 Low NIK 27109 H SA 41 41 41 PENZI VAM CHRIF SESTI 4 170146 WIRE ITH 116 14 11 1017710 HI LENT 307A WICK 1405 41 3 ICICI 11 12 SF 36 21 1916 2734 1902 474 PRE 11 33 SIT 611 TV LEE UN SI MONTA SISI 11.17 1112 14710 Weekly Sales Unit Price Distribution Sales Vene Werks Vw V Varis V Vw 151 NE TIENE EN 119 SAS 0 V1 154 1790 134140 21770 2013 22 ISTI 1 2 1 4 1 0 ISNIS F FECER w 0 2.1 163 21 TS 119354 4 1221977 1062 149629 3 14 900 T w 112 I WICE LOLLI 11122 ENTRS CONNIE 0 LOISID 11212 OSE I NEVE SK ESTE PIZIE 114.3 0 1 . FLETU 11 11 111111 12. 18120 M25 14224471 16.19 122 0 10 PI LE IM 16 1022021 TV EF 1917 TM WM 11 6106 4130421 141631 161 0 ANTIS UN 1444 51113 O 8 43 SESSTE CHILLI CH LI 732730 TUT 19 2552 MEME IT ENE NET ( 2007.1 2011 1931 1485 11102 0 0 19 HL 45136 27600 117324 IWW 16 17 0 NAS 2014 WIRE 2015 1414 IT IMPER TWINS THE 11. 0 10 SEN 1 STIR 35301 LEWE 2015 TYLE 234 0 SS 72113 0 IN 19 20 21 22 23 30 6724 1349 1201 1921 311420 SIWE WCZNIK SLEACH 0 2011 11 19 JA SHS 111 0374 700 TA START 2001 165.44 15215 154371 1111 1113 T.39 2016 1011 T2664 145 4111 IVA ESE LIHAT 234 14112.17 1911 ICICIL 0 0 CELE ISTII MT2017 011 19.629111 0 0 181843 29 36 21 28 IC LI 16 31 24 0173 FOOD HA 1441 0 2015 189 034 7140 57577 2722 51404.37 44100 213411 TIV w 1955 SI NE INI TEORI 0 IVINI 1140 0 WIL SER SETS 11 11 13 11 4322 52472 31021 14123 11100 12 2013 1201 177127 123 105 4014112 11 150412 427925 52 SPIN LC 14 1411 713400 1. 2194 23 21441 1991 STRE TERE 11 LI CERI 11 SELLE ES HE 30:19 4113 SIWA 31970 43 16 1214700 102 15 SILA COM 40 LL HE 150 LINA wa 1015 19 401 OP PWP LV 19 VER SH 211741 421431 HINO 721745 40 11 2 TEN 23070 IP 44 VINE NE NE CEREDEL LOS 12001 16101 10.45 ILE DELL 467 773 41 4112345 2221 TUN 45031 25141 SESSI HER TES 43 44 NI CEESH $25 SI 10142 10 2014 31 333 10) 11 Low NIK 27109 H SA 41 41 41 PENZI VAM CHRIF SESTI 4 170146 WIRE ITH 116 14 11 1017710 HI LENT 307A WICK 1405 41 3 ICICI 11 12 SF 36 21 1916 2734 1902 474 PRE 11 33 SIT 611 TV LEE UN SI MONTA SISI 11.17 1112 14710 WILL LE MITTE IL VILLE IST NE LER SE 2 HE LICE HE ISUAL 7114 23 213 12545 SRP 21 16 COEL TENT 1210 ET WHITE MIN 02 . SCENE CI TIE WORLD SESI RE 11 w 176143 1154 TRE 943 AT WE IS IT NE BUZ HO 16 2013 LAWAN LID 1 5541 1173 14 1993 545 SOI TE WEST SI IN HT ORIE NE IS ELE HERE MESE TIME CERE HEI ET 112111 110 11740 14753 w 1815 CX WER COM 21 1182 19 CE 34 ITS FEE IFTE 17 IPUIN w w IN SELLE C D SC SEST 11 41 MEBLE INNER NLM EN 1 7950 1900 WIRE GE 115 NE NET US . . 2016 12 57571 ET MUS SELF 1 2561 2 o 0 0 0 7151 LE ENA CE CH HEVUE THE TER w 21 30 2012 4545 75 0 O WIE TERSE HITS SIE CERIT 124 LE INT FREE 11 IN 34.16 LE SC DET . . 0 SEX SI SIL WT 1 1 20 w 75 14 419 SW . 11.11 TESSE ON NE 0 CANE ITIO 110111 TE WIN 0 0 200 IT LEER SIM STINE VI SALE VIT I ESIS w 1141 0 TES IN 191116 AZ S500 544 3126 EMER 71117 100 AI 0 0 19 212837 SS ACESTE SELI AL VII 301 347 . 0 0 2011 1900 1 THE 10 4 IM ICE 150 IMT 157 RE 0 . 0 LET WITH II SESTI FIZIE 14 1 22 30013 LOS 45 BOSE 1 11912 ELLE TE 0 0 SO SI TV 14 1757700 H04510 172177 WICE BE NE TUT . ITAINE PIN BENCE . 75724 23 57051 1 WOLLE SUNT 18 0 INT Var Sale Distribution Unit Price Weekly SalesStep by Step Solution
There are 3 Steps involved in it

Get step-by-step solutions from verified subject matter experts