

Question: The attached data set is an Excel file with three spreadsheets (Sales data.xlsx). The Excel file contains sales, pricing and distribution figures of the different
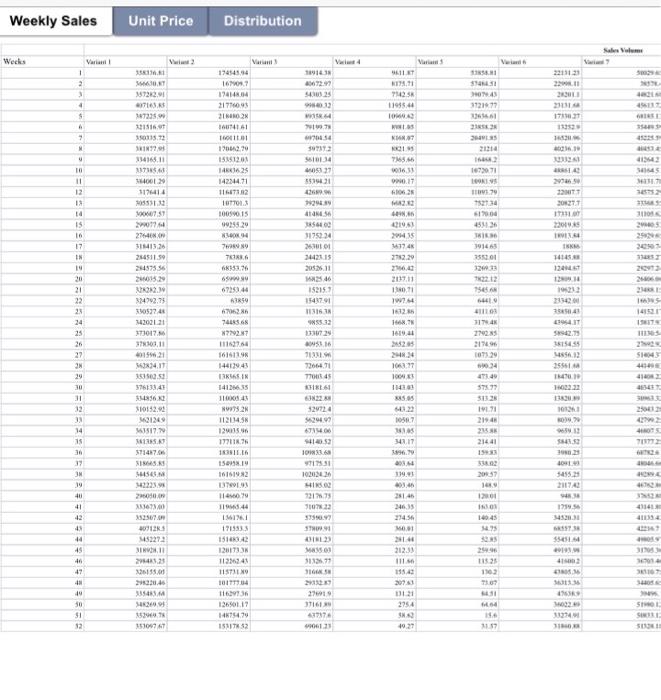
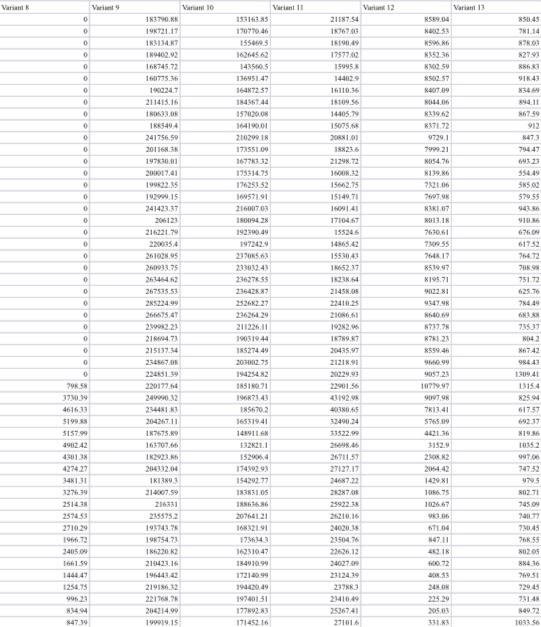
Weekly Sales Unit Price Distribution Works ZIR View Variant 1 2 3 4 . 35722.01 TER 1472359 Vi 189143 0727 S400.25 13 w 1745454 16 1941 21716093 212 11 LT 17.11 71 119354 TOWO 2213120 2011 21 ITS NO LASTELE WICE 4611 5 CONNIE 601 VISI TE SELOSE NESTE ETC 2 111 054 3712 WWE DO M PERS 7MM C I TO 1611 ST 05327 579421 1673071 LON IT HER 11 12 13 102.70 15110 141625 14224471 1166732 1077013 100590.15 0919920 LOR CA NEW CHE WWE mit 1121 13414.11 1071 4400120 1176414 03531.12 7.57 2077.14 27640 31413.26 284511.50 25457555 2015.20 P1 297865 NITT 201211 1113102 2301 TWIN W PIP 15 16 52734 $120.00 459136 THIS 191465 38561 31753 24 2010 25 2929 ONAL 101 WINNE 17 IN DISE I TH 12 219.53 2014 15 14794 2752.29 27,40 2017.11 10.71 17.44 2013 2013 19 20 21 22 TER 53.24 65 0725344 43859 6762 7488.68 2 MERON 15 w 1923 3442115 2052611 46 152153 1548791 181 1532 3730729 NSI 16 TE NZ DE 2014 3964 TT 25 26 1815455 324792.75 1053241 14202121 3130170 110111 40159621 3234.17 . 5763341 1836.2 1012 e WIL 41113 7174 27925 21 07329 034 4119 1. 1619 2425 29.24 104117 100 LE EWS S1604 1118 161619 14419:43 SIN 14115 1100043 444 2N 29 7364.71 T700 45 61 TM 41 DE LLE 5 31328 JI 12 NESEN 1611 ENOL POSZ SRIW DOS SO 14 153517. 1120145 121 1711 $24724 4294 64.00 414052 100 SER 219.40 25 21441 15 USSEN 43.5 91 SESI SE VE LE WE 341 17 . . 1191 BE TROT 571417. NIMAS 44565 14222.9 20 ISHI 150933.19 1015192 2007 5455 19 TALLET 10203030 INC 21779 9012 401 WY ZOEK SER 41 42 15 12201 IN 140.45 4114 11 44 11 17133 151342 TCHES TUIT SA 109123 453273 LASES KIE CINDY co 43 14 45 46 47 28145 246,15 274.56 M 24 212.33 111 1514 2074 17.30 5561 WANIE MCELINCI MAS Ver VIL 25 12 11234 414 . 31107 TESTI WIE VENT 41 19.03 24 341 4. COLE LE 151 II VO ni OS IS 15 10117764 163 136501.19 14679479 1512 2754 21 316 43717 01.11 100 1374 ST SI CS 92 51007AT 40.27 LSI IS Varian V Variant 11 0 SK ESTESE RSE 04 85049 0 TEINE 170770.46 1550 0 NOSS 596 192.16 KV50 O | 0 0 45 BOSS 0 0 0 143560.5 13695149 16487257 14.14 1520.00 164190.01 21029018 17AS5100 1672012 195914 17125852 0 03 271 RE SI 43 344 11 N650 912 1471 79443 6123 35449 55.00 57955 19 Va 12 21987.54 1767.00 1619049 175772 15995 14402 16110.16 1510456 14405. 15075 2085101 18235 21298.72 JOON. 13 1562.75 15149.71 1941 1710467 155345 1465 1993040 1652.17 NOT.09 04.06 119.62 371.72 97291 799921 MAS44 139.6 O 0 O 0 0 901742 0 16 ELS 0 0 0 TON RUKI 13.18 76.70.60 20:55 764 17 851997 VI 6760 61732 7642 0 0 0 0 NYEZII 12 5618 0 Van 10 183790.5 19K721.17 131367 IN44022 166745.72 168735.36 1400247 211415.16 180633.08 1494 241756.50 201163 1971 20001741 199602.15 19299915 241423.37 206123 211221.79 2200354 261025 20033.25 263454.62 267535.53 25224 26675 47 200052.23 211473 21513744 234567.00 22403150 22017764 24999012 234481 204267.11 1x7675.9 165709 12923.5 2012.04 IKERS 21400759 214331 2355752 19874 196754.1 16462202 210421.16 196.444 22.81 2145 224111.25 751.72 625.76 7449 0 2755 0 199NOIZ 0 LESEZ 0 MM 0 N60 87115 878121 $59.46 0.99 9037.23 1071997 0 0 79.58 3709 461611 N6L16 2160703 18009428 19244 1972029 2370553 2330124 236275 236425 226227 2626 211226.11 1901944 18527449 200125 1942542 18171 196714) 156702 165319:41 1419 132621.1 55290. 17419293 154292.77 18383105 186 2076621 16832191 1714 16251047 134910 17212999 19042049 19740151 1778923 171452.16 7611.41 5765.9 4421.16 9116 $1998 S157.99 1982.42 4301 427427 1932.95 1579.67 20435 YT 21218.92 20229.23 2001.56 4192.98 4038045 33490.34 13522.99 20 21911.57 27127.17 24637.22 280x720 259221 2010.16 2402014 21504.76 22626.12 X6743 98443 1309.41 315.4 2504 61757 692.17 1936 0352 99700 747.52 NS ROZITI 705 ON 700 77 7045 70 55 02.03 884.36 269.31 72945 22 206442 1401 1086.75 1024.67 06 11.00 4711 ICINTE 1276.39 25143 25745 2710-29 2 34050 1661.59 144447 1254.78 99623 WELZOTT 0.72 [ TE WIGIZ 23124.39 2373 2141849 24.08 235.29 2050 STINE 2217620 206314.99 199019.15 1494 840 72 10335 5471 211016
Step by Step Solution
There are 3 Steps involved in it

Get step-by-step solutions from verified subject matter experts