

Question: + Optional Assignment Question 3 of 4 - 75 III View Policies Current Attempt in Progress The following information is available for The Coca-Cola Company
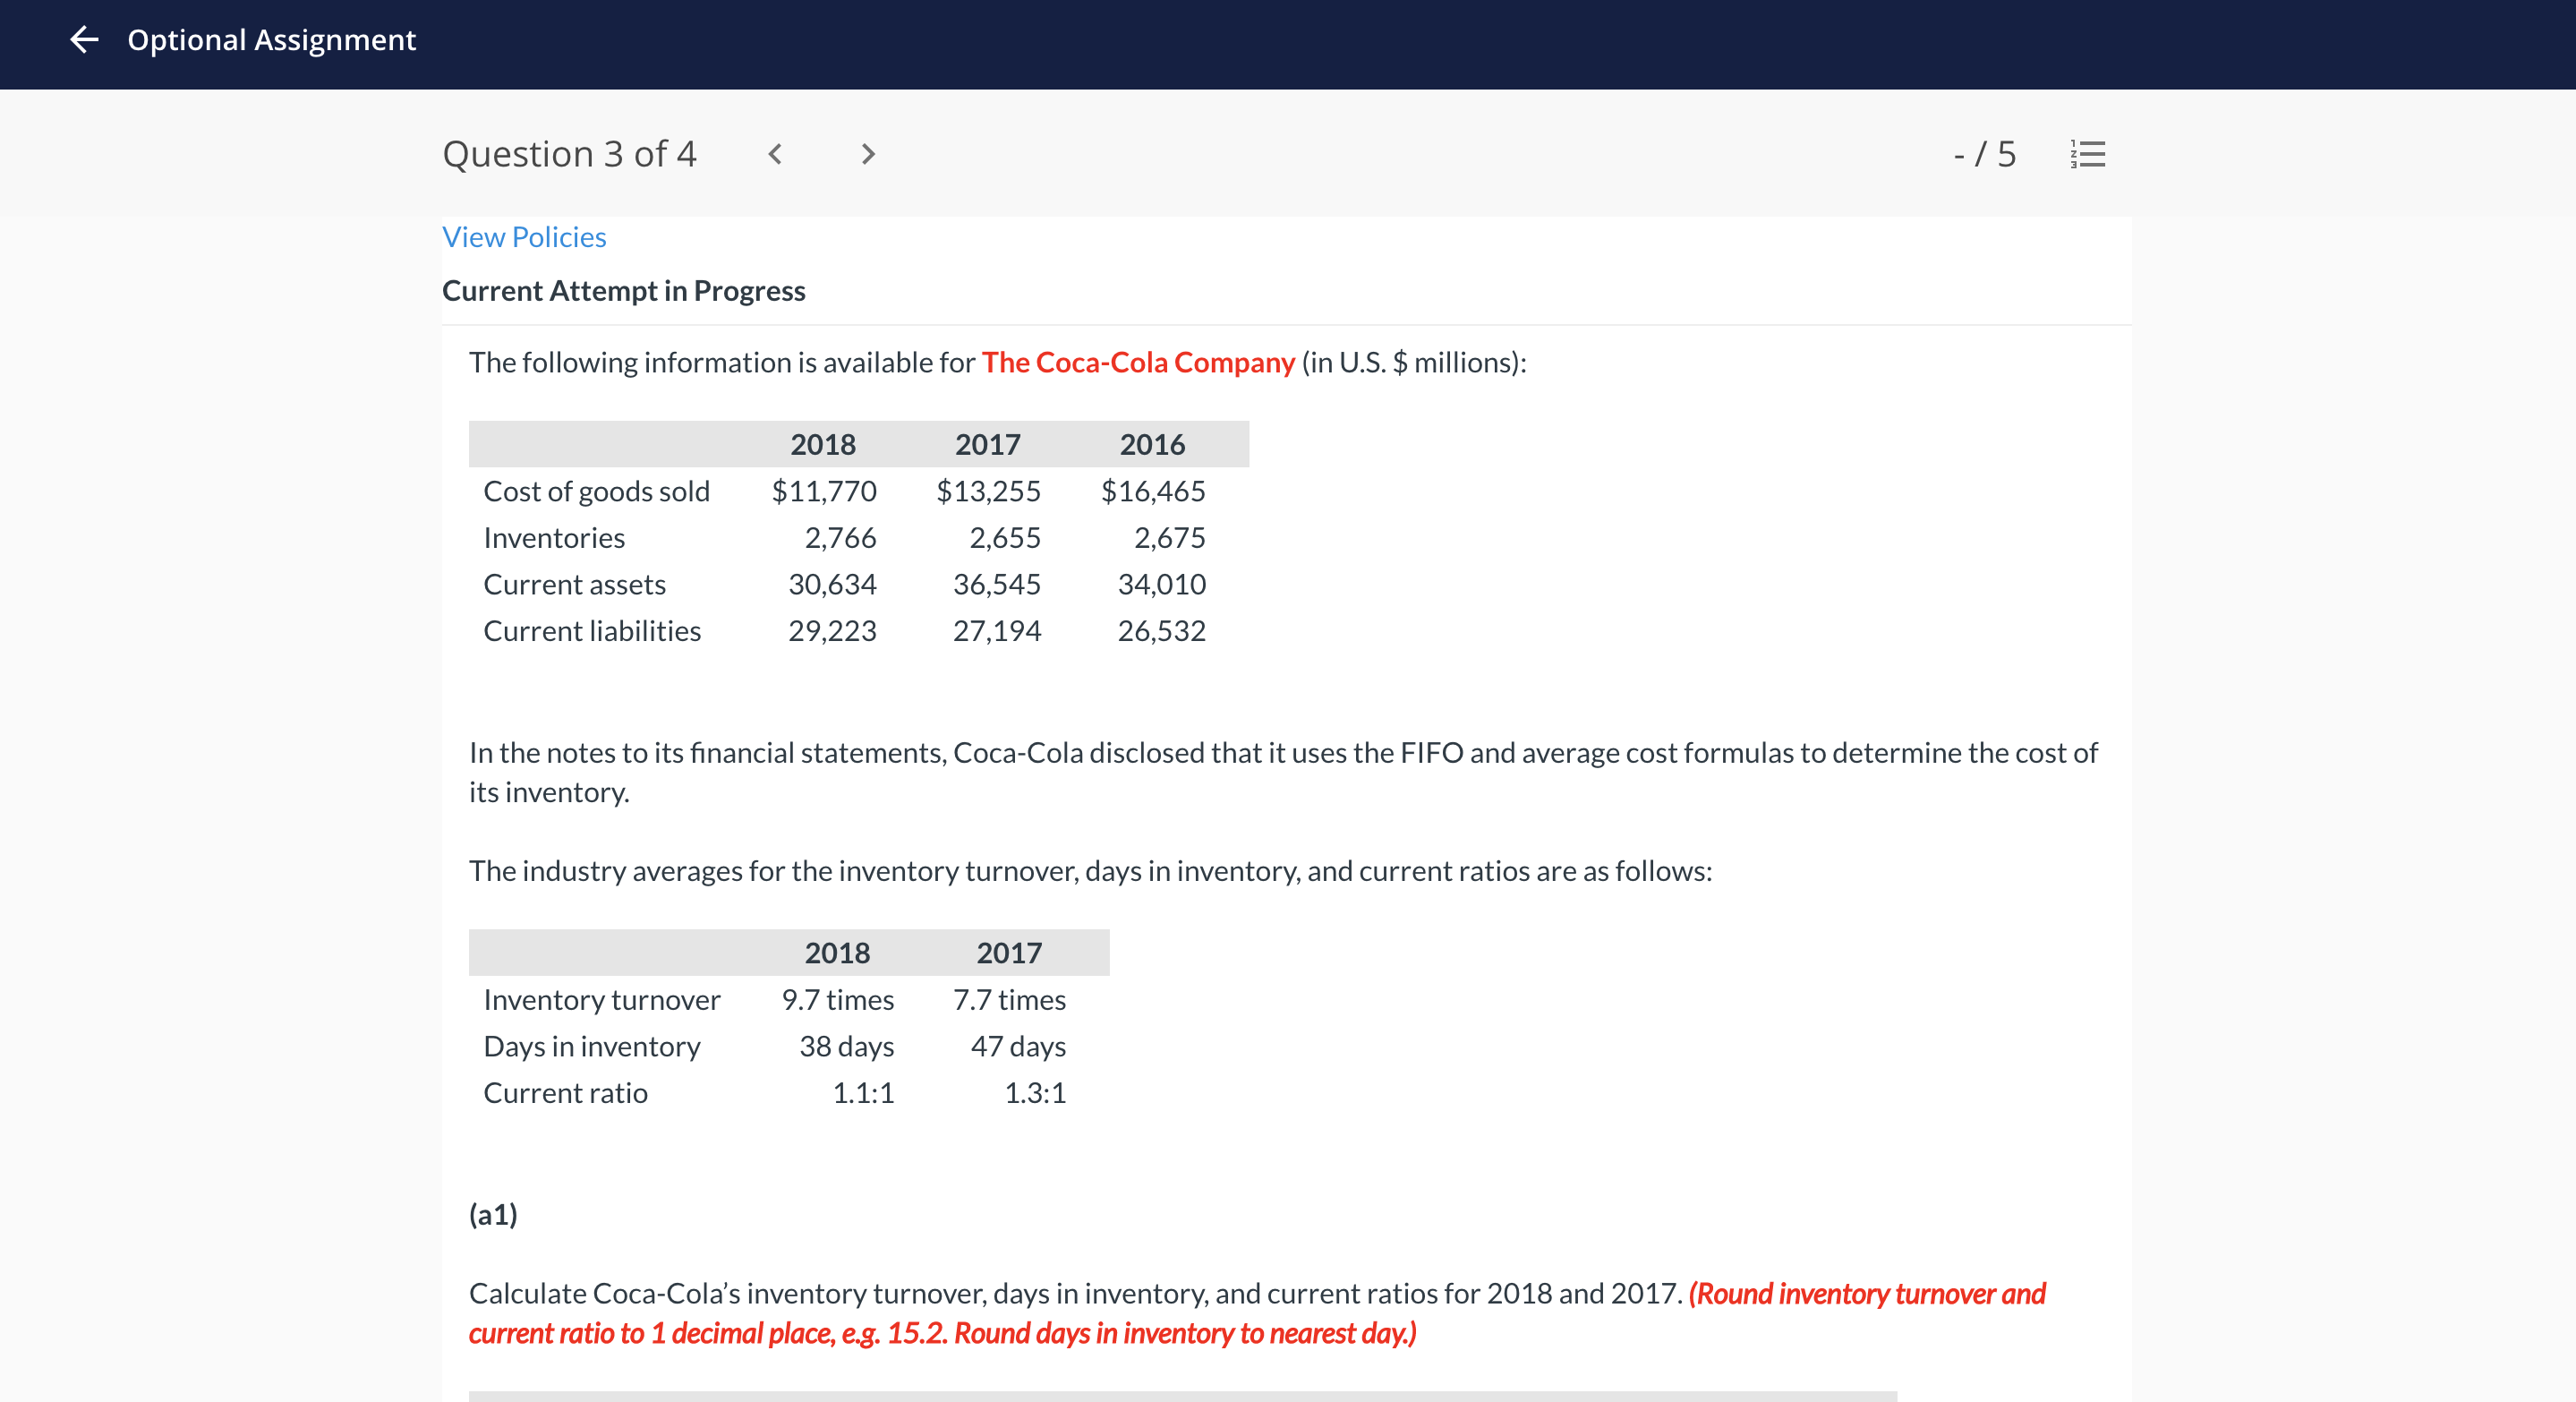
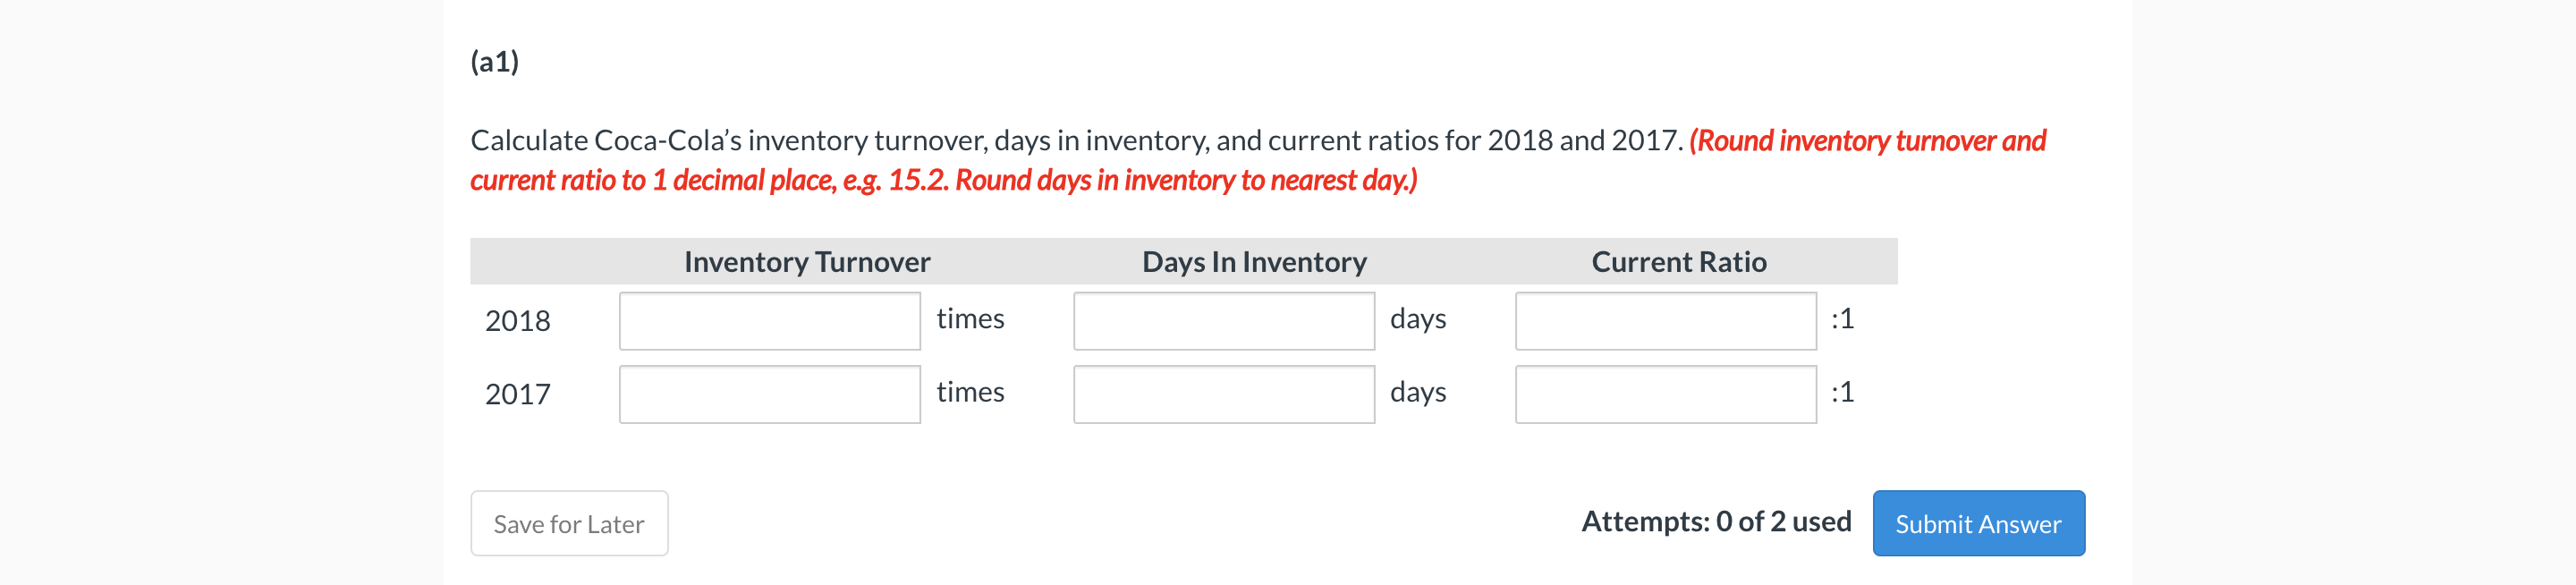
+ Optional Assignment Question 3 of 4 - 75 III View Policies Current Attempt in Progress The following information is available for The Coca-Cola Company (in U.S. $ millions): 2018 2017 Cost of goods sold Inventories Current assets Current liabilities $11,770 2,766 30,634 29,223 $13,255 2,655 36,545 27,194 2016 $16,465 2,675 34,010 26,532 In the notes to its financial statements, Coca-Cola disclosed that it uses the FIFO and average cost formulas to determine the cost of its inventory. The industry averages for the inventory turnover, days in inventory, and current ratios are as follows: 2018 2017 9.7 times 7.7 times Inventory turnover Days in inventory Current ratio 38 days 47 days 1.1:1 1.3:1 (a1) Calculate Coca-Cola's inventory turnover, days in inventory, and current ratios for 2018 and 2017. (Round inventory turnover and current ratio to 1 decimal place, e.g. 15.2. Round days in inventory to nearest day.) (a 1) Calculate Coca-Cola's inventory turnover, days in inventory, and current ratios for 2018 and 2017. (Round inventory turnover and current ratio to 1 decimal place, e.g. 15.2. Round days in inventory to nearest day.) Inventory Turnover Days In Inventory Current Ratio 2018 times days :1 2017 times days :1 Save for Later Attempts: 0 of 2 used Submit
Step by Step Solution
There are 3 Steps involved in it

Get step-by-step solutions from verified subject matter experts