

Question: OPTIONS FOR DROP DOWN: (LAST QUESTION) The first quartile for the previous year is _____(lower than, equal to, or higher than)the first quartile for the
OPTIONS FOR DROP DOWN: (LAST QUESTION)
The first quartile for the previous year is _____(lower than, equal to, or higher than)the first quartile for the current year and the third quartile for the previous year is_____(lower than, equal to, or higher than)the third quartile for the current year. Also, the median for the previous year is _____(lower than, equal to, or higher than)the median for the current year. Since______(just one of the values, two values, OR all three values)for the current year are_____(lower than, equal to, or higher than) those reported for the previous year, unemployment rates across the states are _____(decreasing, increasing, OR not changing.)
.
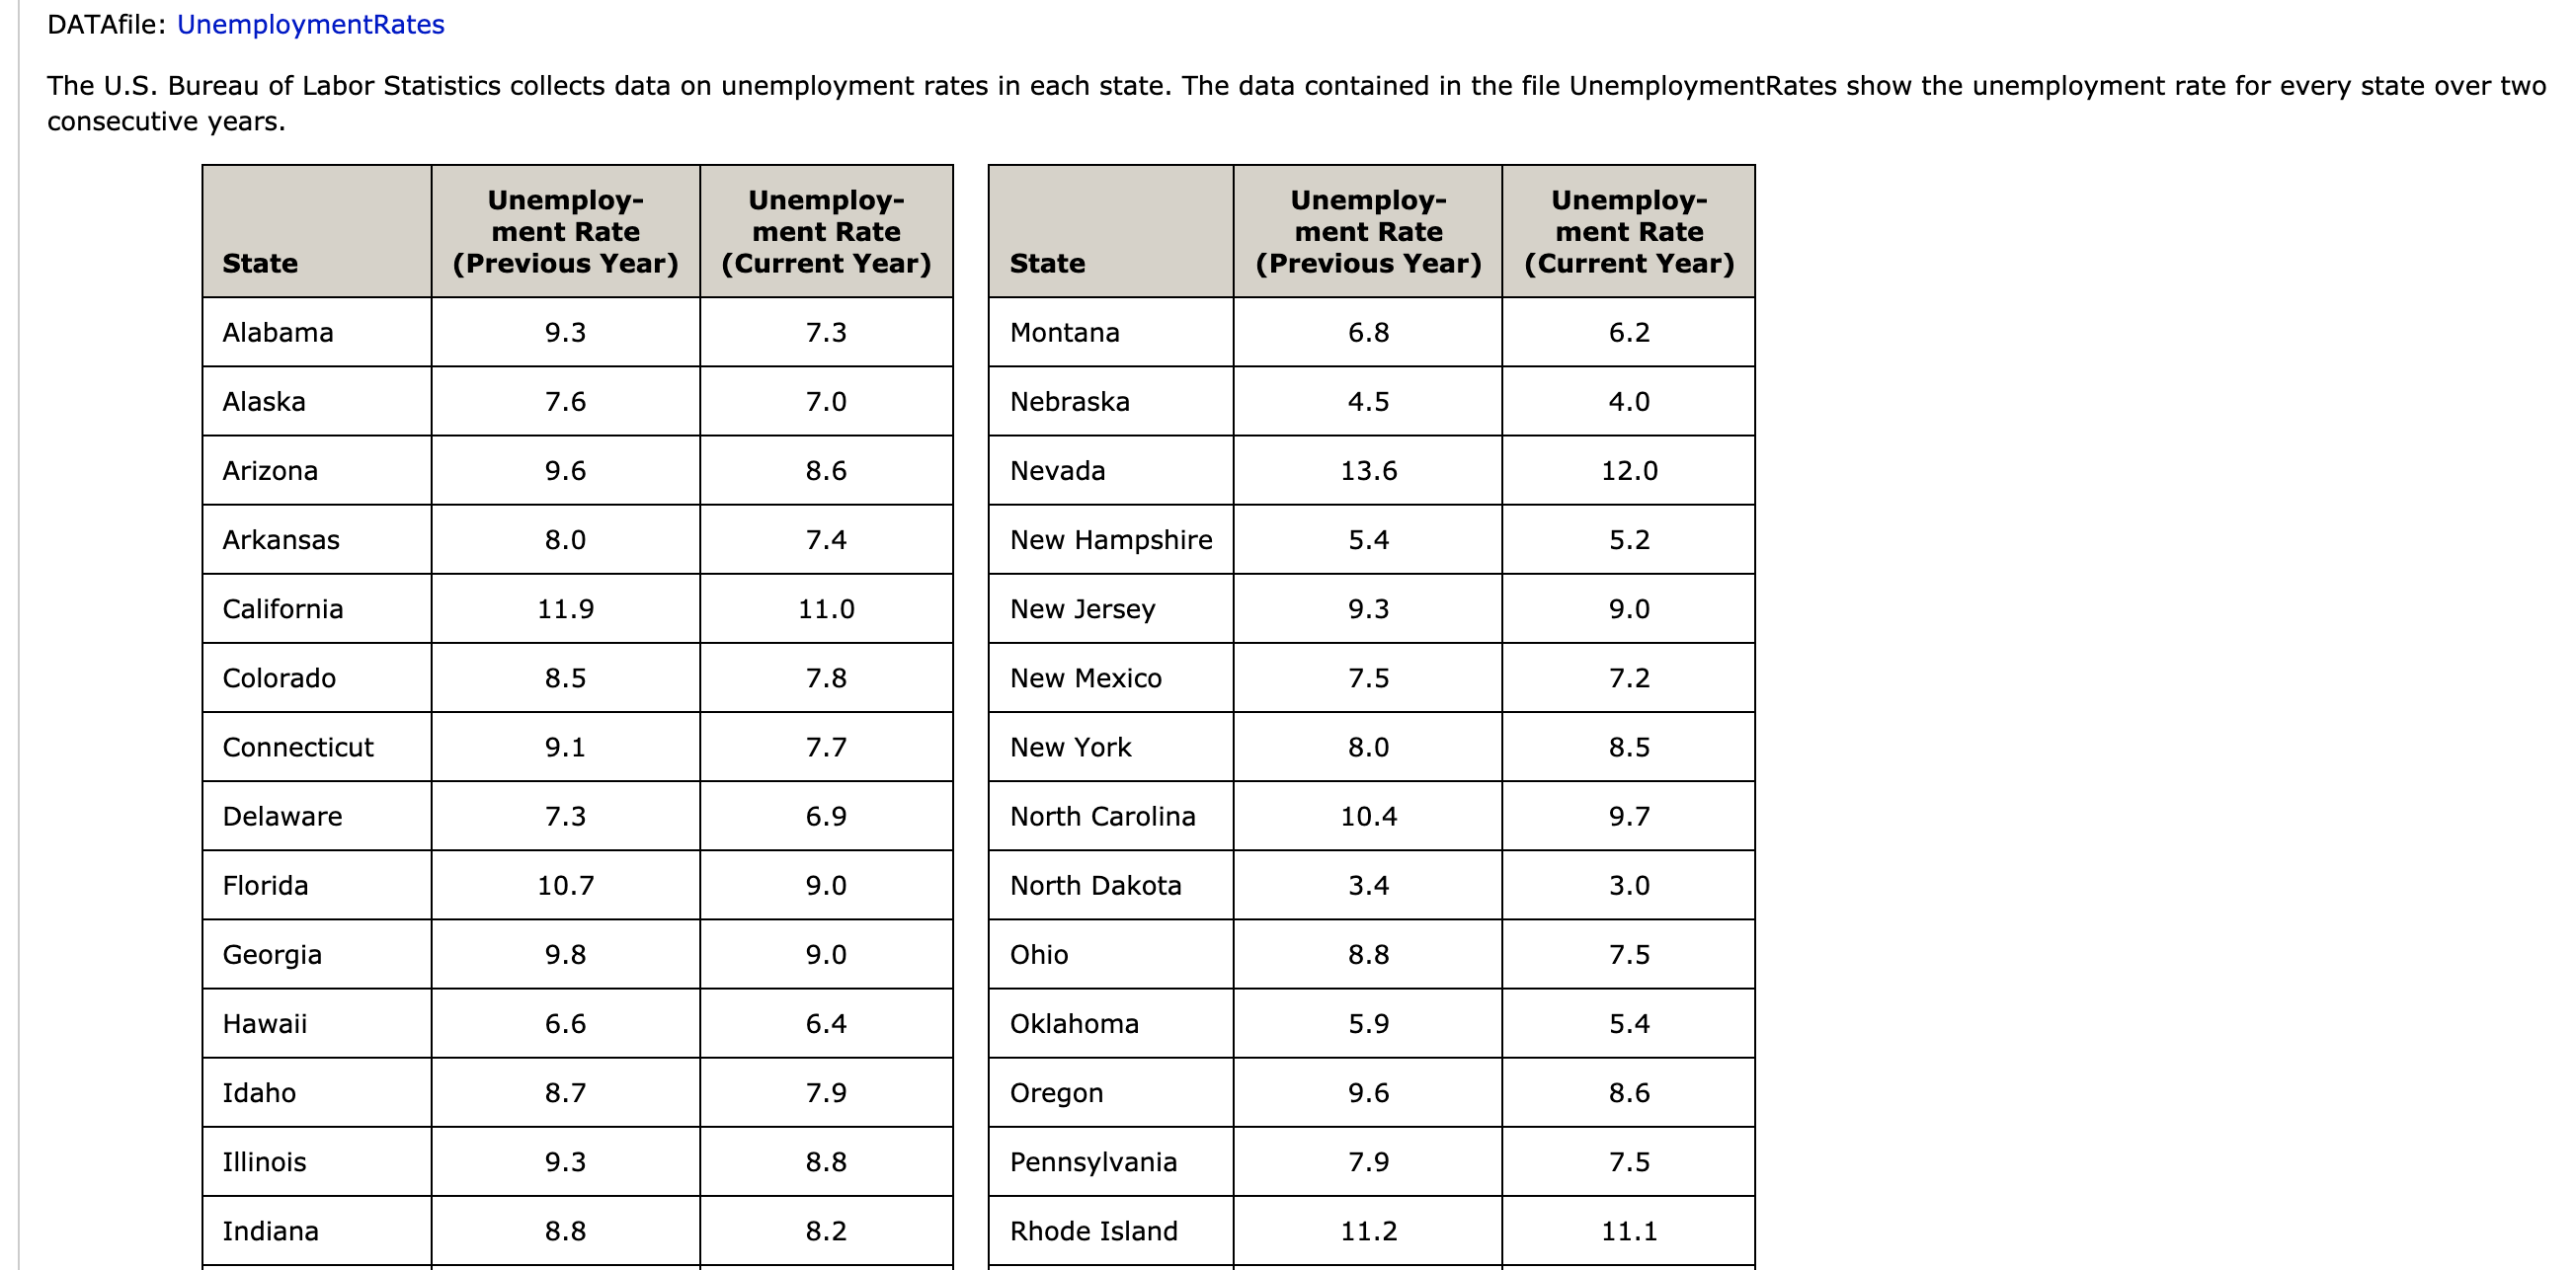
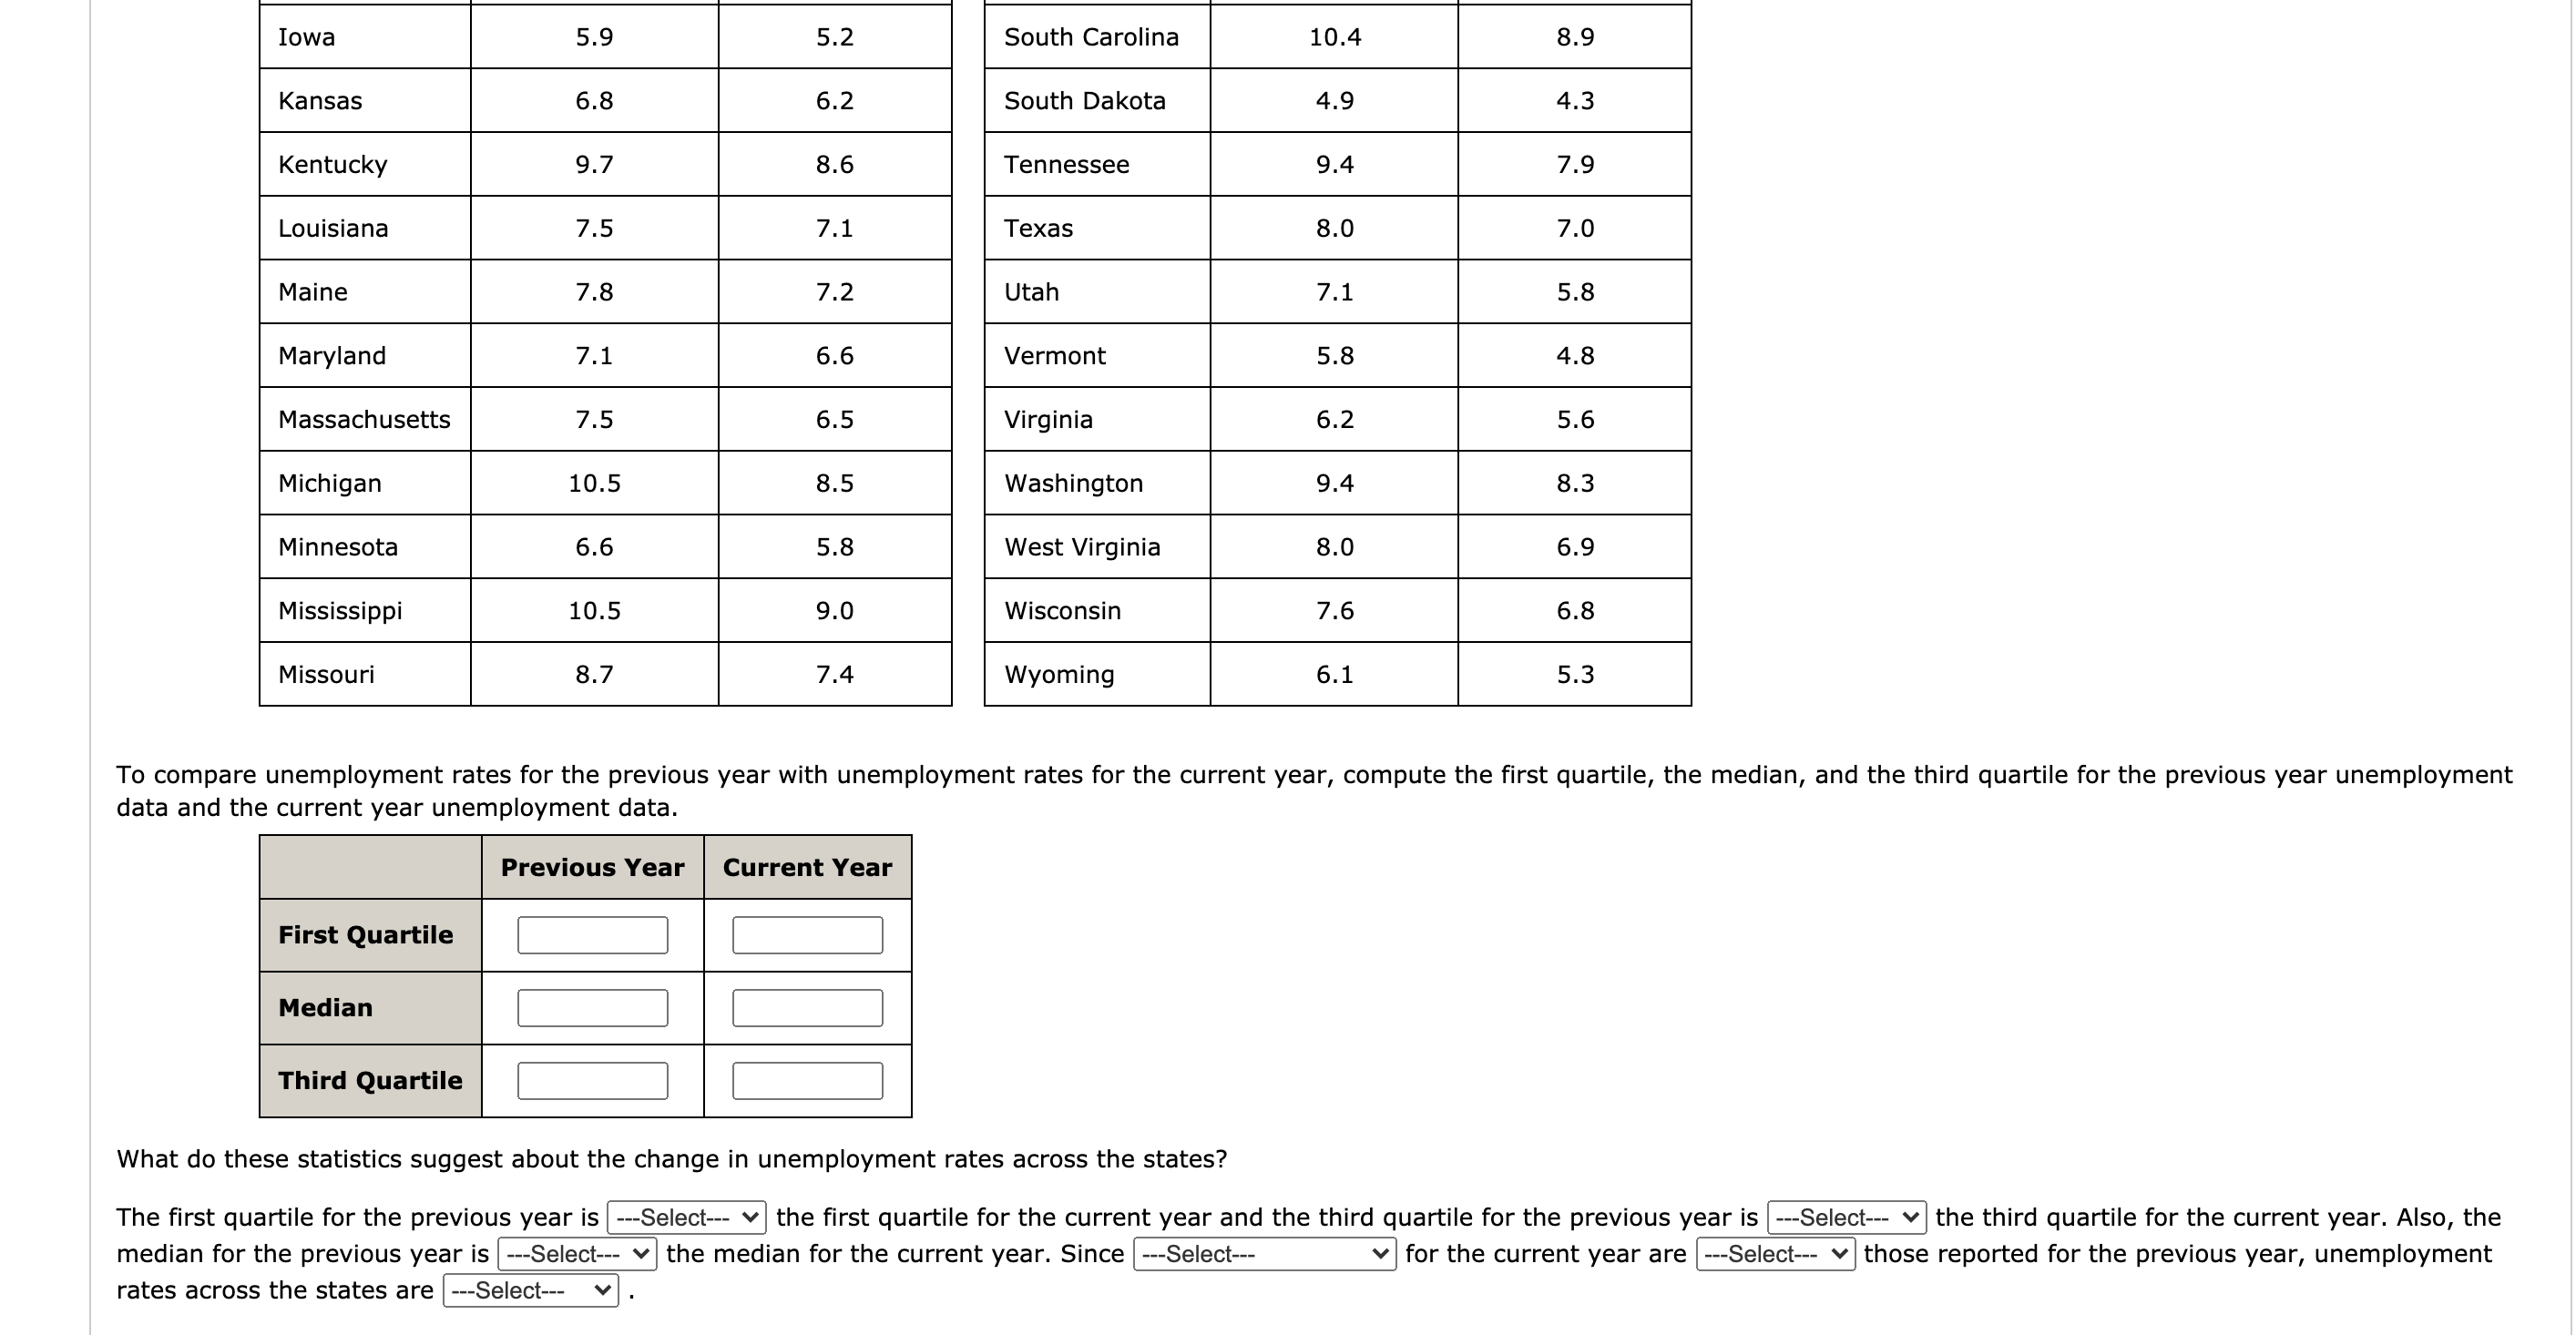 DATAfile: UnemploymentRates The U.S. Bureau of Labor Statistics collects data on unemployment rates in each state. The data contained in the file UnemploymentRates show the unemployment rate for every state over two consecutive years. Unemploy- Unemploy- Unemploy- Unemploy- ment Rate ment Rate ment Rate ment Rate State (Previous Year) (Current Year) State (Previous Year) (Current Year) Alabama 9.3 7.3 Montana 6.8 6.2 Alaska 7.6 7.0 Nebraska 4.5 4.0 Arizona 9.6 8.6 Nevada 13.6 12.0 Arkansas 8.0 7.4 New Hampshire 5.4 5.2 California 11.9 11.0 New Jersey 9.3 9.0 Colorado 8.5 7.8 New Mexico 7.5 7.2 Connecticut 9.1 7.7 New York 8.0 8.5 Delaware 7.3 6.9 North Carolina 10.4 9.7 Florida 10.7 9.0 North Dakota 3.4 3.0 Georgia 9.8 9.0 Ohio 8.8 7.5 Hawaii 6.6 6.4 Oklahoma 5.9 5.4 Idaho 8.7 7.9 Oregon 9.6 8.6 Illinois 9.3 8.8 Pennsylvania 7.9 7.5 Indiana 8.8 8.2 Rhode Island 11.2 11.1Iowa 5.9 5.2 South Carolina 10.4 8.9 Kansas 6.8 6.2 South Dakota 4.9 4.3 Kentucky 9.7 8.6 Tennessee 9.4 7.9 Louisiana 7.5 7.1 Texas 8.0 7.0 Maine 7.8 7.2 Utah 7.1 5.8 Maryland 7.1 6.6 Vermont 5.8 4.8 Massachusetts 7.5 6.5 Virginia 6.2 5.6 Michigan 10.5 8.5 Washington 9.4 8.3 Minnesota 6.6 5.8 West Virginia 8.0 6.9 Mississippi 10.5 9.0 Wisconsin 7.6 6.8 Missouri 8.7 7.4 Wyoming 6.1 5.3 To compare unemployment rates for the previous year with unemployment rates for the current year, compute the first quartile, the median, and the third quartile for the previous year unemployment data and the current year unemployment data. Previous Year Current Year First Quartile Median Third Quartile What do these statistics suggest about the change in unemployment rates across the states? The first quartile for the previous year is ---Select--- | the first quartile for the current year and the third quartile for the previous year is ---Select--- | the third quartile for the current year. Also, the median for the previous year is ---Select--- | the median for the current year. Since ---Select--- for the current year are ---Select--- |those reported for the previous year, unemployment rates across the states are ---Select--- v
Step by Step Solution
There are 3 Steps involved in it

Get step-by-step solutions from verified subject matter experts