

Question: Options Summary statistics: Column n Mean Variance Std. dev. Std. err. Median Range Min Max Q1 Q3 10th Per. Engine Size (L) 750 3.59804 0.23026304
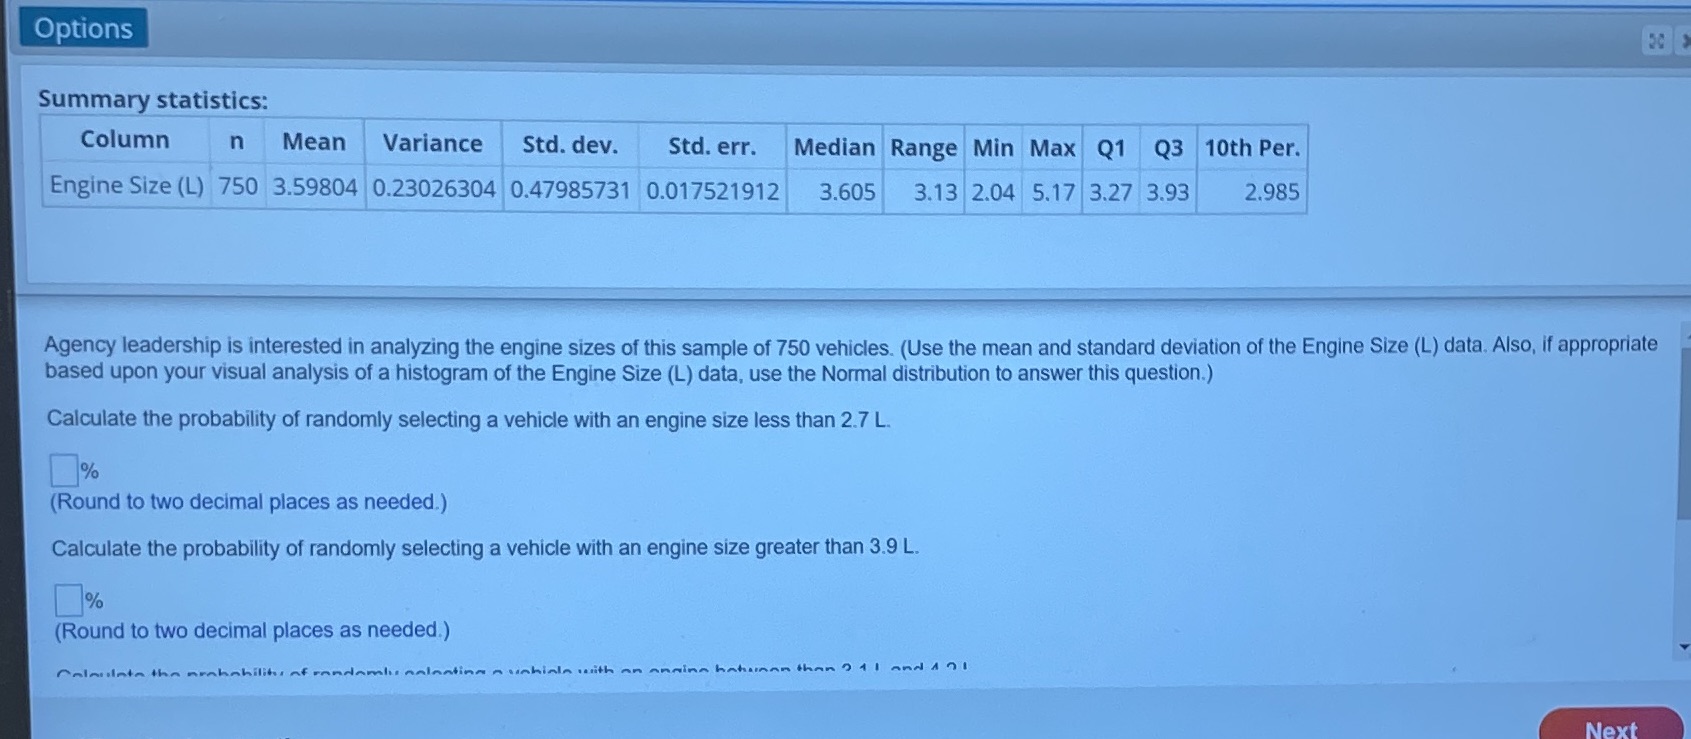
Options Summary statistics: Column n Mean Variance Std. dev. Std. err. Median Range Min Max Q1 Q3 10th Per. Engine Size (L) 750 3.59804 0.23026304 0.47985731 0.017521912 3.605 3.13 2.04 5.17 3.27 3.93 2.985 Agency leadership is interested in analyzing the engine sizes of this sample of 750 vehicles. (Use the mean and standard deviation of the Engine Size (L) data. Also, if appropriate based upon your visual analysis of a histogram of the Engine Size (L) data, use the Normal distribution to answer this question.) Calculate the probability of randomly selecting a vehicle with an engine size less than 2.7 L. % (Round to two decimal places as needed.) Calculate the probability of randomly selecting a vehicle with an engine size greater than 3.9 L. % (Round to two decimal places as needed.) 241 And 171 Next
Step by Step Solution
There are 3 Steps involved in it

Get step-by-step solutions from verified subject matter experts