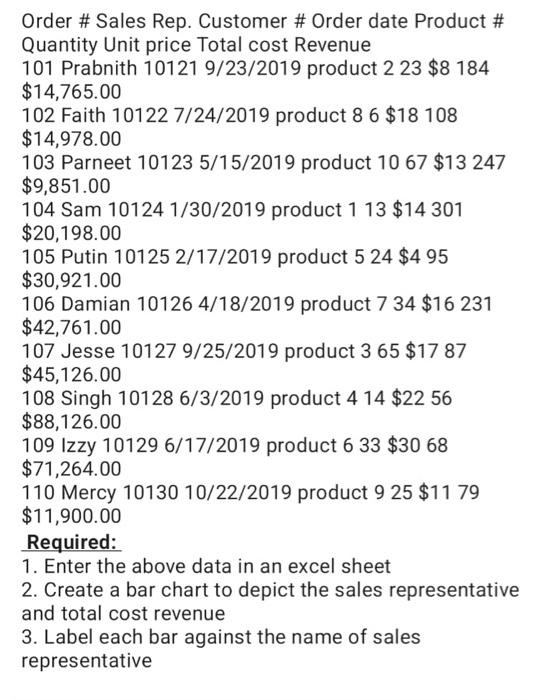
Question: Order # Sales Rep. Customer # Order date Product # Quantity Unit price Total cost Revenue 101 Prabnith 101219/23/2019 product 223$8184 $14,765.00 102 Faith 101227/24/2019

Order # Sales Rep. Customer # Order date Product
Order # Sales Rep. Customer # Order date Product # Quantity Unit price Total cost Revenue 101 Prabnith 101219/23/2019 product 223$8184 $14,765.00 102 Faith 101227/24/2019 product 86$18108 $14,978.00 103 Parneet 101235/15/2019 product 1067$13247 $9,851.00 104 Sam 101241/30/2019 product 113$14301 $20,198.00 105 Putin 101252/17/2019 product 524$495 $30,921.00 106 Damian 101264/18/2019 product 734$16231 $42,761.00 107 Jesse 101279/25/2019 product 365$1787 $45,126.00 108 Singh 101286/3/2019 product 414$2256 $8,126.00 109 Izzy 101296/17/2019 product 633$3068 $71,264.00 110 Mercy 1013010/22/2019 product 925$1179 $11,900.00 Required: 1. Enter the above data in an excel sheet 2. Create a bar chart to depict the sales representative and total cost revenue 3. Label each bar against the name of sales representative

Step by Step Solution

There are 3 Steps involved in it

1 Expert Approved Answer
Step: 1 Unlock blur-text-image
Question Has Been Solved by an Expert!

Get step-by-step solutions from verified subject matter experts

Step: 2 Unlock
Step: 3 Unlock

Students Have Also Explored These Related General Management Questions!