

Question: Order your data in an analysis sheet and draw a Pareto Chart for total unit injuries by department. Now answer the following questions: 1. Does
- Order your data in an analysis sheet and draw a Pareto Chart for total unit injuries by department.
Now answer the following questions:
1. Does the Pareto Principle apply?
2. Where should you concentrate your efforts?
3. Do your proposed solutions pass a sanity check?
- Order your data in analysis sheet and draw a Pareto Chart of Injuries by Type. Would the Pareto Principle apply if we analyzed our data based on injuries of type?
Now answer the following questions:
1. Does the Pareto Principle apply?
2. Where should you concentrate your efforts?
3. Do your proposed solutions pass a sanity check?
- What if you looked at the number of personnel assigned to each department? Here are those numbers:
Prepare a new analysis sheet and draw a Pareto Chart using this new information.
1. Does the Pareto Principle apply?
2. Where should you concentrate your efforts? What are the results indicating?
| Department | Number of Personnel |
| Maintenance | 200 |
| Operations | 10 |
| Administration | 10 |
| Safety | 5 |
| Training | 5 |
3. Do your proposed solutions pass a sanity check?
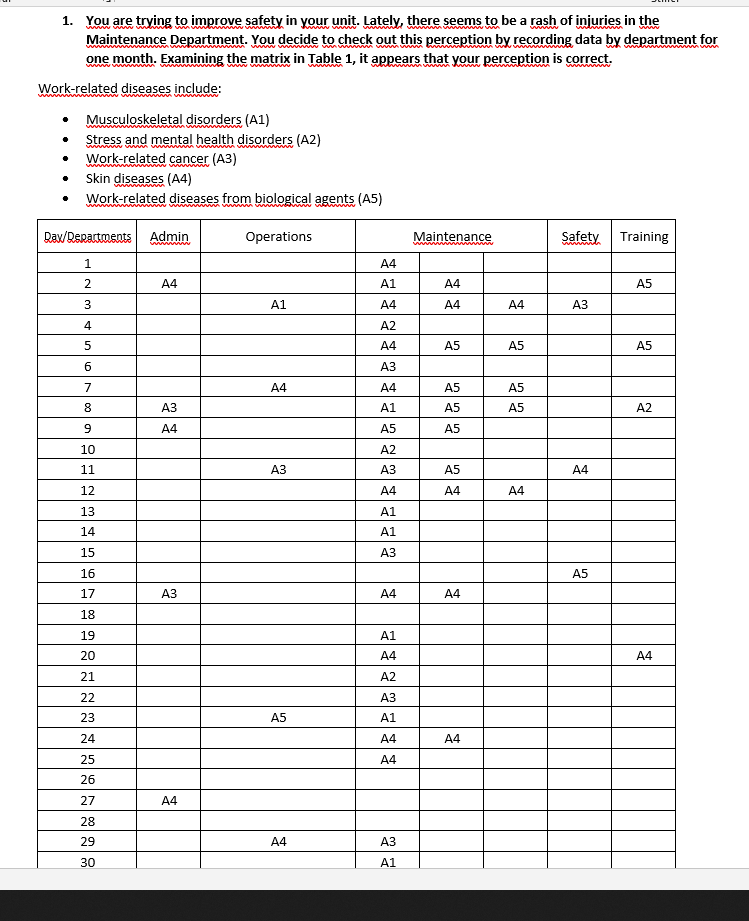
1. You are trying to improve safety in your unit. Lately, there seems to be a rash of injuries in the Maintenance Department. You decide to check out this perception by recording data by department for one month. Examining the matrix in Table 1, it appears that your perception is correct. Work-related diseases include: Musculoskeletal disorders (A1) Stress and mental health disorders (A2) Work-related cancer (A3) Skin diseases (A4) Work-related diseases from biological agents (A5) Dax/Repartments Admin Operations Safety Training Maintenance ] A4 A 4 | A5 A1 A4 A3 A4 A1 A4 A2 A4 A3 A4 | A5 A5 5 A5 A5 A5 A5 A1 ] A5 A5 A2 A5 A3 A5 A4A4 A1 A1 A4 A2 A3 A1 A4A4 A4 A3 A1Step by Step Solution
There are 3 Steps involved in it

Get step-by-step solutions from verified subject matter experts