

Question: QUALITY MANAGEMENT . Task 1.Order your data in an analysis sheet and draw a Pareto Chart for total unit injuries by department. 2.From the Pareto,
QUALITY MANAGEMENT
.
Task
1.Order your data in an analysis sheet and draw a Pareto Chart for total unit injuries by department.
2.From the Pareto, where should you concentrate your efforts?
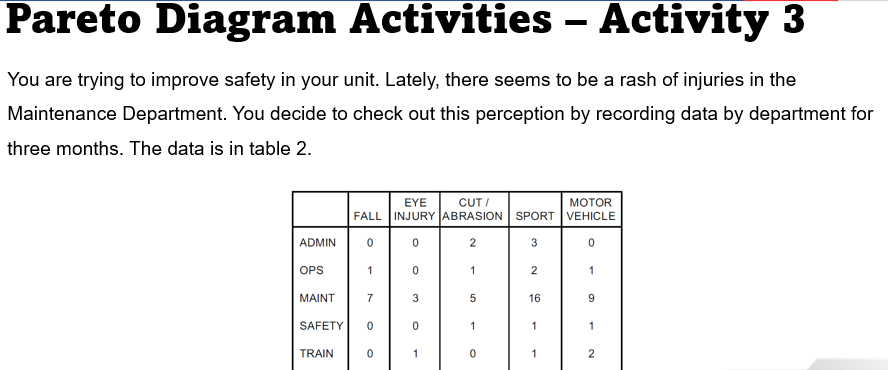
Pareto Diagram Activities - Activity 3 3 - You are trying to improve safety in your unit. Lately, there seems to be a rash of injuries in the Maintenance Department. You decide to check out this perception by recording data by department for three months. The data is in table 2. EYE CUT/ MOTOR FALL INJURY ABRASION SPORT VEHICLE ADMIN 0 0 2 3 0 OPS 1 0 1 2 1 MAINT 7 3 5 16 9 SAFETY 0 0 1 1 1 TRAIN 0 1 0 1 NStep by Step Solution
There are 3 Steps involved in it
1 Expert Approved Answer
Step: 1 Unlock

Question Has Been Solved by an Expert!
Get step-by-step solutions from verified subject matter experts
Step: 2 Unlock
Step: 3 Unlock