

Use the graphs to briefly explain how each of these vital statistics behaves over the business cycle
Fantastic news! We've Found the answer you've been seeking!
Question:
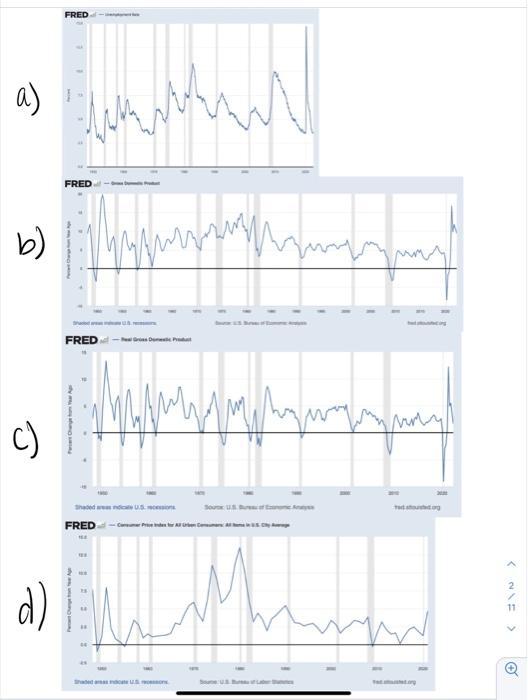
Use the graphs to briefly explain how each of these vital statistics behaves over the business cycle (i.e. before, during, and after recessions).
. a) Unemployment Rate
. b) Nominal GDP growth
c) Real GDP growth.
d) Inflation
Expert Answer:
ANSWER The unemployment rate is the percentage of the labor force without a job It is a lagg... View the full answer

Related Book For 

Fundamentals of Electric Circuits
ISBN: 9780073301150
3rd edition
Authors: Matthew Sadiku, Charles Alexander
Posted Date:
