

Anita Bailey is the newly appointed traffic man- California; (2) Phoenix, Arizona; (3) Salt Lake ager...
Fantastic news! We've Found the answer you've been seeking!
Question:
Transcribed Image Text:
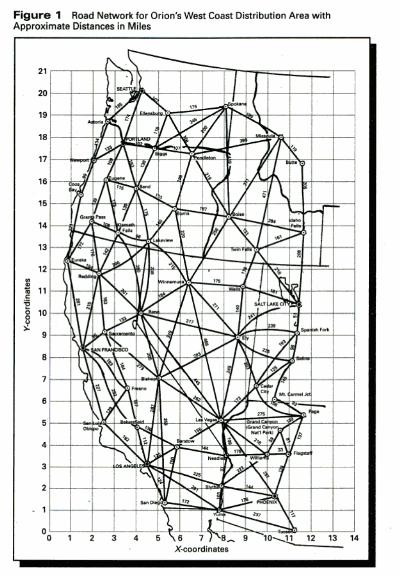
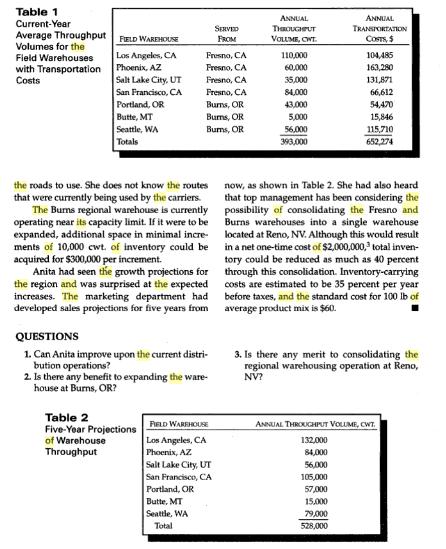
Anita Bailey is the newly appointed traffic man- California; (2) Phoenix, Arizona; (3) Salt Lake ager for Orion Foods, a packer of a wide variety City, Utah; (4) San Francisco, California; (5) of fruits and vegetables sold throughout the Portland, Oregon; (6) Butte, Montana; and (7) United States. The first project given her by her Seattle, Washington. Currently, the Burns boss, the director of operations, is to "clean up regional distribution center serves Portland, the distribution mess in the West." Compared Seattle, and Butte field warehouses. The Fresno with product distribution in other parts of the distribution center supplies the remaining field United States, the cost to distribute the product warehouses. The capacities for the regional dis- in the West Coast area is considered excessively tribution centers are 50,000 cwt.' of inventory for Fresno and 15,000 cwt. of inventory for Burns. Each has a turnover ratio? of eight. The field warehouses have average annual through- put volumes as given in Table 1. Additional high. Surely costs can be reduced, she thought. CURRENT DISTRIBUTION Orion packs throughout the United States its location data are given in Appendix A. line of fruits and vegetables and even imports some of its product line from regions such as move its products between regional and field Orion contracts with trucking companies to South America and Canada. In the western warehouses. Its contract reads that it will pay its United States, as shown in Figure 1, Orion has carriers $1.30 per mile for truckload quantities established regional distribution centers at Fresno, California and Burns, Oregon. From these master warehouses, field, or local, ware- that average 30,000 lb, the typical shipment size. Anita understands that her predecessor had left the choice of the specific routes to travel to the Figure 1 Road Network for Orion's West Coast Distribution Area with Approximate Distances in Miles 21 SEATTE 20 19 18 ortLAND" 17 16 15 Gearg P 14 13 12 11 SALTLAE O 10 S 9 SAN FRANCISCO 6 4 3. 2 San D 2 3 4 16 1011 12 13 14 X-coordinates Y-coordinates Table 1 ANNUAL ANNUAL Current-Year SERVED FROM TRANSIORTATION Average Throughput Volumes for the Field Warehouses with Transportation Costs FIELD WAREHOUSE VOLUME, CWE COTS, S Los Angeles, CA Phoenix, AZ Salt Lake City, UT San Francisco, CA Fresno, CA 110,000 104,485 Fresno, CA 60.000 163,280 Fresno, CA 35,000 131,871 Fresno, CA 84,000 66,612 Portland, OR Butte, MT Seattle, WA Totals Burns, OR 43,000 54,470 Burns, OR 5,000 15,846 Burms, OR 56,000 115,710 393,000 652,274 now, as shown in Table 2. She had also heard that top management has been considering the possibility of consolidating the Fresno and Burns warehouses into a single warehouse located at Reno, NV. Although this would result in a net one-time cost of $2,000,000,3 total inven- the roads to use. She does not know the routes that were currently being used by the carriers. The Burms regional warehouse is currently operating near its capacity limit. If it were to be expanded, additional space in minimal incre- ments of 10,000 cwt. of inventory could be acquired for $300,000 per increment. Anita had seen the growth projections for the region and was surprised at the expected increases. The marketing department had developed sales projections for five years from tory could be reduced as much as 40 percent through this consolidation. Inventory-carrying costs are estimated to be 35 percent per year before taxes, and the standard cost for 100 lb of average product mix is $60. QUESTIONS 1. Can Anita improve upon the current distri- bution operations? 2. Is there any benefit to expanding the ware- house at Burns, OR? 3. Is there any merit to consolidating the regional warehousing operation at Reno, NV? Table 2 Five-Year Projections of Warehouse Throughput FIELD WARRHOUSE ANNUAL THROUGHPUT VOLUME, CWT. Los Angeles, CA 132,000 Phoenix, AZ 84,000 Salt Lake City, UT San Francisco, CA 56,000 105,000 57,000 15.000 Portland, OR Butte, MT Seattle, WA 79.000 Total 528,000 Anita Bailey is the newly appointed traffic man- California; (2) Phoenix, Arizona; (3) Salt Lake ager for Orion Foods, a packer of a wide variety City, Utah; (4) San Francisco, California; (5) of fruits and vegetables sold throughout the Portland, Oregon; (6) Butte, Montana; and (7) United States. The first project given her by her Seattle, Washington. Currently, the Burns boss, the director of operations, is to "clean up regional distribution center serves Portland, the distribution mess in the West." Compared Seattle, and Butte field warehouses. The Fresno with product distribution in other parts of the distribution center supplies the remaining field United States, the cost to distribute the product warehouses. The capacities for the regional dis- in the West Coast area is considered excessively tribution centers are 50,000 cwt.' of inventory for Fresno and 15,000 cwt. of inventory for Burns. Each has a turnover ratio? of eight. The field warehouses have average annual through- put volumes as given in Table 1. Additional high. Surely costs can be reduced, she thought. CURRENT DISTRIBUTION Orion packs throughout the United States its location data are given in Appendix A. line of fruits and vegetables and even imports some of its product line from regions such as move its products between regional and field Orion contracts with trucking companies to South America and Canada. In the western warehouses. Its contract reads that it will pay its United States, as shown in Figure 1, Orion has carriers $1.30 per mile for truckload quantities established regional distribution centers at Fresno, California and Burns, Oregon. From these master warehouses, field, or local, ware- that average 30,000 lb, the typical shipment size. Anita understands that her predecessor had left the choice of the specific routes to travel to the Figure 1 Road Network for Orion's West Coast Distribution Area with Approximate Distances in Miles 21 SEATTE 20 19 18 ortLAND" 17 16 15 Gearg P 14 13 12 11 SALTLAE O 10 S 9 SAN FRANCISCO 6 4 3. 2 San D 2 3 4 16 1011 12 13 14 X-coordinates Y-coordinates Table 1 ANNUAL ANNUAL Current-Year SERVED FROM TRANSIORTATION Average Throughput Volumes for the Field Warehouses with Transportation Costs FIELD WAREHOUSE VOLUME, CWE COTS, S Los Angeles, CA Phoenix, AZ Salt Lake City, UT San Francisco, CA Fresno, CA 110,000 104,485 Fresno, CA 60.000 163,280 Fresno, CA 35,000 131,871 Fresno, CA 84,000 66,612 Portland, OR Butte, MT Seattle, WA Totals Burns, OR 43,000 54,470 Burns, OR 5,000 15,846 Burms, OR 56,000 115,710 393,000 652,274 now, as shown in Table 2. She had also heard that top management has been considering the possibility of consolidating the Fresno and Burns warehouses into a single warehouse located at Reno, NV. Although this would result in a net one-time cost of $2,000,000,3 total inven- the roads to use. She does not know the routes that were currently being used by the carriers. The Burms regional warehouse is currently operating near its capacity limit. If it were to be expanded, additional space in minimal incre- ments of 10,000 cwt. of inventory could be acquired for $300,000 per increment. Anita had seen the growth projections for the region and was surprised at the expected increases. The marketing department had developed sales projections for five years from tory could be reduced as much as 40 percent through this consolidation. Inventory-carrying costs are estimated to be 35 percent per year before taxes, and the standard cost for 100 lb of average product mix is $60. QUESTIONS 1. Can Anita improve upon the current distri- bution operations? 2. Is there any benefit to expanding the ware- house at Burns, OR? 3. Is there any merit to consolidating the regional warehousing operation at Reno, NV? Table 2 Five-Year Projections of Warehouse Throughput FIELD WARRHOUSE ANNUAL THROUGHPUT VOLUME, CWT. Los Angeles, CA 132,000 Phoenix, AZ 84,000 Salt Lake City, UT San Francisco, CA 56,000 105,000 57,000 15.000 Portland, OR Butte, MT Seattle, WA 79.000 Total 528,000
Expert Answer:
Answer rating: 100% (QA)
The US Department of Agricultures USDA minimum general recommendation is five servings of fruits and ... View the full answer

Related Book For 
International Business Law and its Environment
ISBN: 9781305972599
10th edition
Authors: Richard Schaffer, Filiberto Agusti, Lucien J. Dhooge
Posted Date:
Students also viewed these accounting questions
-
A shipper of fruits and vegetables delivered a refrigerated van of produce to the S.S. Bayamon at the port of Elizabeth, New Jersey, on September 22 for shipment to San Juan, Puerto Rico. The ship...
-
Some people outside the United States say teens exposed to large doses of U.S. youth culture on MTV will identify less with their own societies and teens in developing countries will want Western...
-
Some states exclude necessities, such as food and clothing, from their sales tax. Other states do not. Discuss the merits of this exclusion. Consider both efficiency and equity.
-
You are the VP of Human Resources for a company with 250 employees. You have both outside sales representatives and inside sales representatives that work primarily by phone. James is an outside...
-
1. How does a decrease in the value of the Mexican peso affect foreign direct investment? 2. How is trade affected by currency devaluations as a result of a financial crisis? 3. How are customers in...
-
Explain what an employer does with the amounts withheld from an employees pay.
-
What are retail banks? What are the main features of their balance sheets?
-
Beck was the general manager of Chilkoot Lumber Co. Haines sold fuel to the company. To persuade Haines to sell on credit, Beck signed a paper by which he promised to pay any debt the lumber company...
-
What is behavioral targeting? How can it be used to exploit business opportunities? What ethical problems can arise from behavioral targeting on the internet? How can combining ethics and psychology...
-
For R, partition the data sets into 60% training and 40% validation and implement the 10-fold cross-validation. Use the statement set. seed(1) to specify the random seed for data partitioning and...
-
9. Write a single Linux command to find all the files somewhere under the /tmp directory that have all of the following properties: (a) owned by user john (b) 33 bytes in size (c) not executable 10....
-
Scenario planning is little more than an educated guess and therefore irrelevant for companies. Discuss.
-
Explain how future value is calculated by illustrating the formula for doing so.
-
How can an organization balance its responsibilities to both shareholders and stakeholders?
-
What is a rights offering?
-
Why might PESTLE analysis be particularly appropriate for companies in the oil industry?
-
please help me Arinder Smith is a junior accountant in Toronto. He has requested your help with completing his personal tax return (T1) for 2021. During 2021, his employer provided him with the...
-
Let (x) = x 2 - 9, g(x) = 2x, and h(x) = x - 3. Find each of the following. (((--) 2
-
The plaintiff, a U.S. citizen, entered into an employment contract with the German firm of Stumm Handel, the defendant. The contract was written entirely in German. Without being able to speak or...
-
Decree No. 507 of the Italian Ministry of Cultural Assets and Natural Sites regulated tickets for admission to monuments, museums, galleries, archaeological digs, parks and gardens classified as...
-
This case illustrates a classic case of the conflict between Islamic law and modern business. In 1991, the Federal Shariah Court of Pakistan declared the payment of interest (riba) by banks on loans...
-
At what height above the surface of Pluto is the acceleration due to gravity half its surface value?
-
Consider the spring-cart system of Figure 15.1 again. The cart is pulled away from its equilibrium position in the positive \(x\) direction and then released at \(t=0\). (a) What is the initial phase...
-
Plot kinetic energy and potential energy as a function of time for the cart in Figure 15. 2. Data from Figure 15. 2 (a) t=0 5=0 (b) 0.09 s (c) 0.18 s x=0 E (d) 0.27 s E K U K U KU KU

Study smarter with the SolutionInn App