

Question: oThe fifth tab in your Financial Statement Analysis Template must be labeled Competitor Income Statements Include the latest income statement for the company selected for
oThe fifth tab in your Financial Statement Analysis Template must be labeled Competitor Income Statements
Include the latest income statement for the company selected for the Excel project along with two or three major competitors.(Only one year of data is shown for each company - the latest year available.)
oThe sixth tab in your Financial Statement Analysis Template must be labeled Competitor Balance Sheets
Include the latest Balance Sheet for the company selected for the Excel project along with two or three major competitors.(Only one year of data is shown for each company - the latest year available.)
oThe seventh tab in your Financial Statement Analysis Template must be labeled Competitor Statements of Cash Flows
Include the Statement of Cash Flows for the company selected for the Excel project along with two or three major competitors.
Make sure that the Income Statement, Balance Sheet, and Cash Flows Statement tie in as follows:
Net Income from Income statement agrees with Net Income on the Statement of Cash Flows
Ending Cash Balance from Statement of Cash Flows agrees with Cash in the Balance Sheet
oThe eighth tab in your Financial Statement Analysis Template must be labeled Historical and Competitor Ratios
The list of ratios to be included are as follows.They should be grouped under the headings, as shown:
Liquidity Ratios
oCurrent Ratio
oQuick Ratio
Leverage Ratios
oDebt to Total Assets Ratio
oDebt Equity Ratio
oLong-Term Debt to Equity
oTimes Interest Earned Ratio
Activity Ratios
oInventory Turnover
oFixed Assets Turnover
oTotal Assets Turnover
oAccounts Receivable Turnover
oAverage Collection Period
Profitability Ratios
oGross Profit Margin
oOperating Profit Margin
oNet Profit Margin
oReturn on Total Assets (ROA)
oReturn on Stockholders' Equity (ROE)
oEarnings Per Share (EPS)
oPrice Earnings Ratio
Calculate the ratios for your chosen company for the last three years, linking the ratio calculations back to the historical financial statement tabs (Tabs 2-4) using formulas.
Calculate the ratios for each of your company's competitors (most recent year only), linking the ratio calculations to the competitor financial statements shown in Tabs 5-7 using formulas.
Using the internet, locate the industry averages for the ratios listed above, and include them in the final column of the ratio tab.Include a footnote on the tab to identify the source of the industry averages.
oOther instructions:
The Excel workbook should be professionally formatted.Professional formatting includes:
All numbers are formatted similarly.The use of decimals, commas for thousands, and other formatting is consistent.
Dollar signs are included in the first and last numbers of each column.
Subtotals and totals are preceded by a single underline.Totals are followed by a double underline.
Line descriptions are indented/bolded in a manner that makes the spreadsheet easy to read.
All totals and subtotals should be calculated using formulas.For an example of which cells may need formulas, please see Exhibit B.
This assignment is due by 11:59 p.m. (ET) on Monday of Module/Week 3.
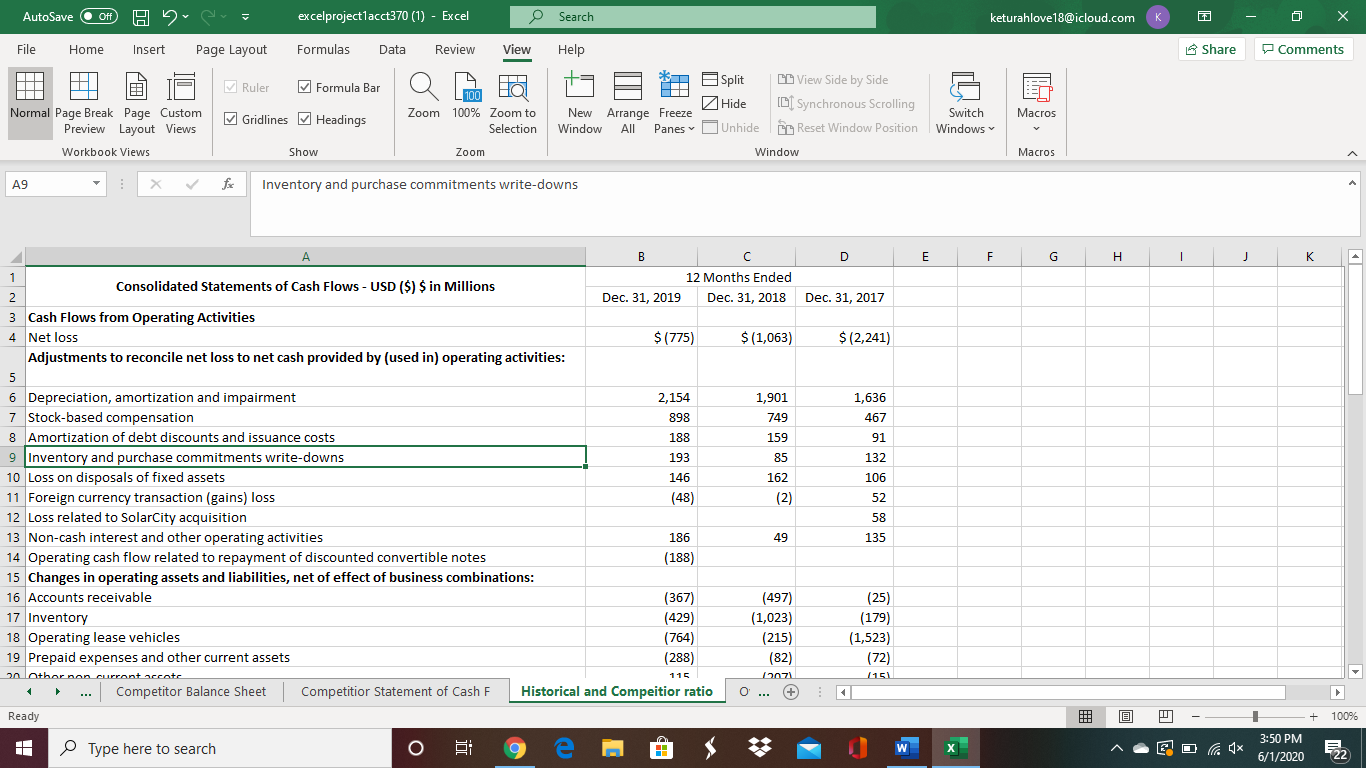
AutoSave O Off) excelproject1acct370 (1) - Excel Search keturahlove18@icloud.com K X File Home Insert Page Layout Formulas Data Review View Help Share Comments Ruler Formula Bar Split DO View Side by Side Hide G Normal Page Break Page Custom Preview Layout Views Gridlines Headings Zoom 100% Zoom to New Arrange Freeze IDSynchronous Scrolling Switch Macros Selection Window All Panes Unhide I En Reset Window Position | Windows Workbook Views Show Zoom Window Macros AS X V Inventory and purchase commitments write-downs A B C D E F G H I J K N - Consolidated Statements of Cash Flows - USD ($) $ in Millions 12 Months Ended Dec. 31, 2019 Dec. 31, 2018 Dec. 31, 2017 Cash Flows from Operating Activities 4 Net loss $ (775) $ (1,063) $ (2,241) Adjustments to reconcile net loss to net cash provided by (used in) operating activities: 6 Depreciation, amortization and impairment 2,154 1,901 1,636 7 Stock-based compensation 898 749 467 8 Amortization of debt discounts and issuance costs 188 159 91 9 Inventory and purchase commitments write-downs 193 85 132 10 Loss on disposals of fixed assets 146 162 106 11 Foreign currency transaction (gains) loss (48) (2) 52 12 Loss related to SolarCity acquisition 58 13 Non-cash interest and other operating activities 186 49 135 14 Operating cash flow related to repayment of discounted convertible notes (188) 15 Changes in operating assets and liabilities, net of effect of business combinations: 16 Accounts receivable (367) (497) 25) 17 Inventory (429) (1,023) 179) 18 Operating lease vehicles (764) (215) (1,523) 19 Prepaid expenses and other current assets 288 ) (82) (72) 20 Other non currant areate 115 ... Competitor Balance Sheet Competition Statement of Cash F Historical and Compeitior ratio O' ... + Ready + 100% Type here to search O 9 e W X 3:50 PM 6/1/2020
Step by Step Solution
There are 3 Steps involved in it

Get step-by-step solutions from verified subject matter experts