

Question: ou can find more information about the FREQUENCY function at Office Support. requency tables and histograms are common methods for describing data. Excel now has
ou can find more information about the FREQUENCY function at Office Support.
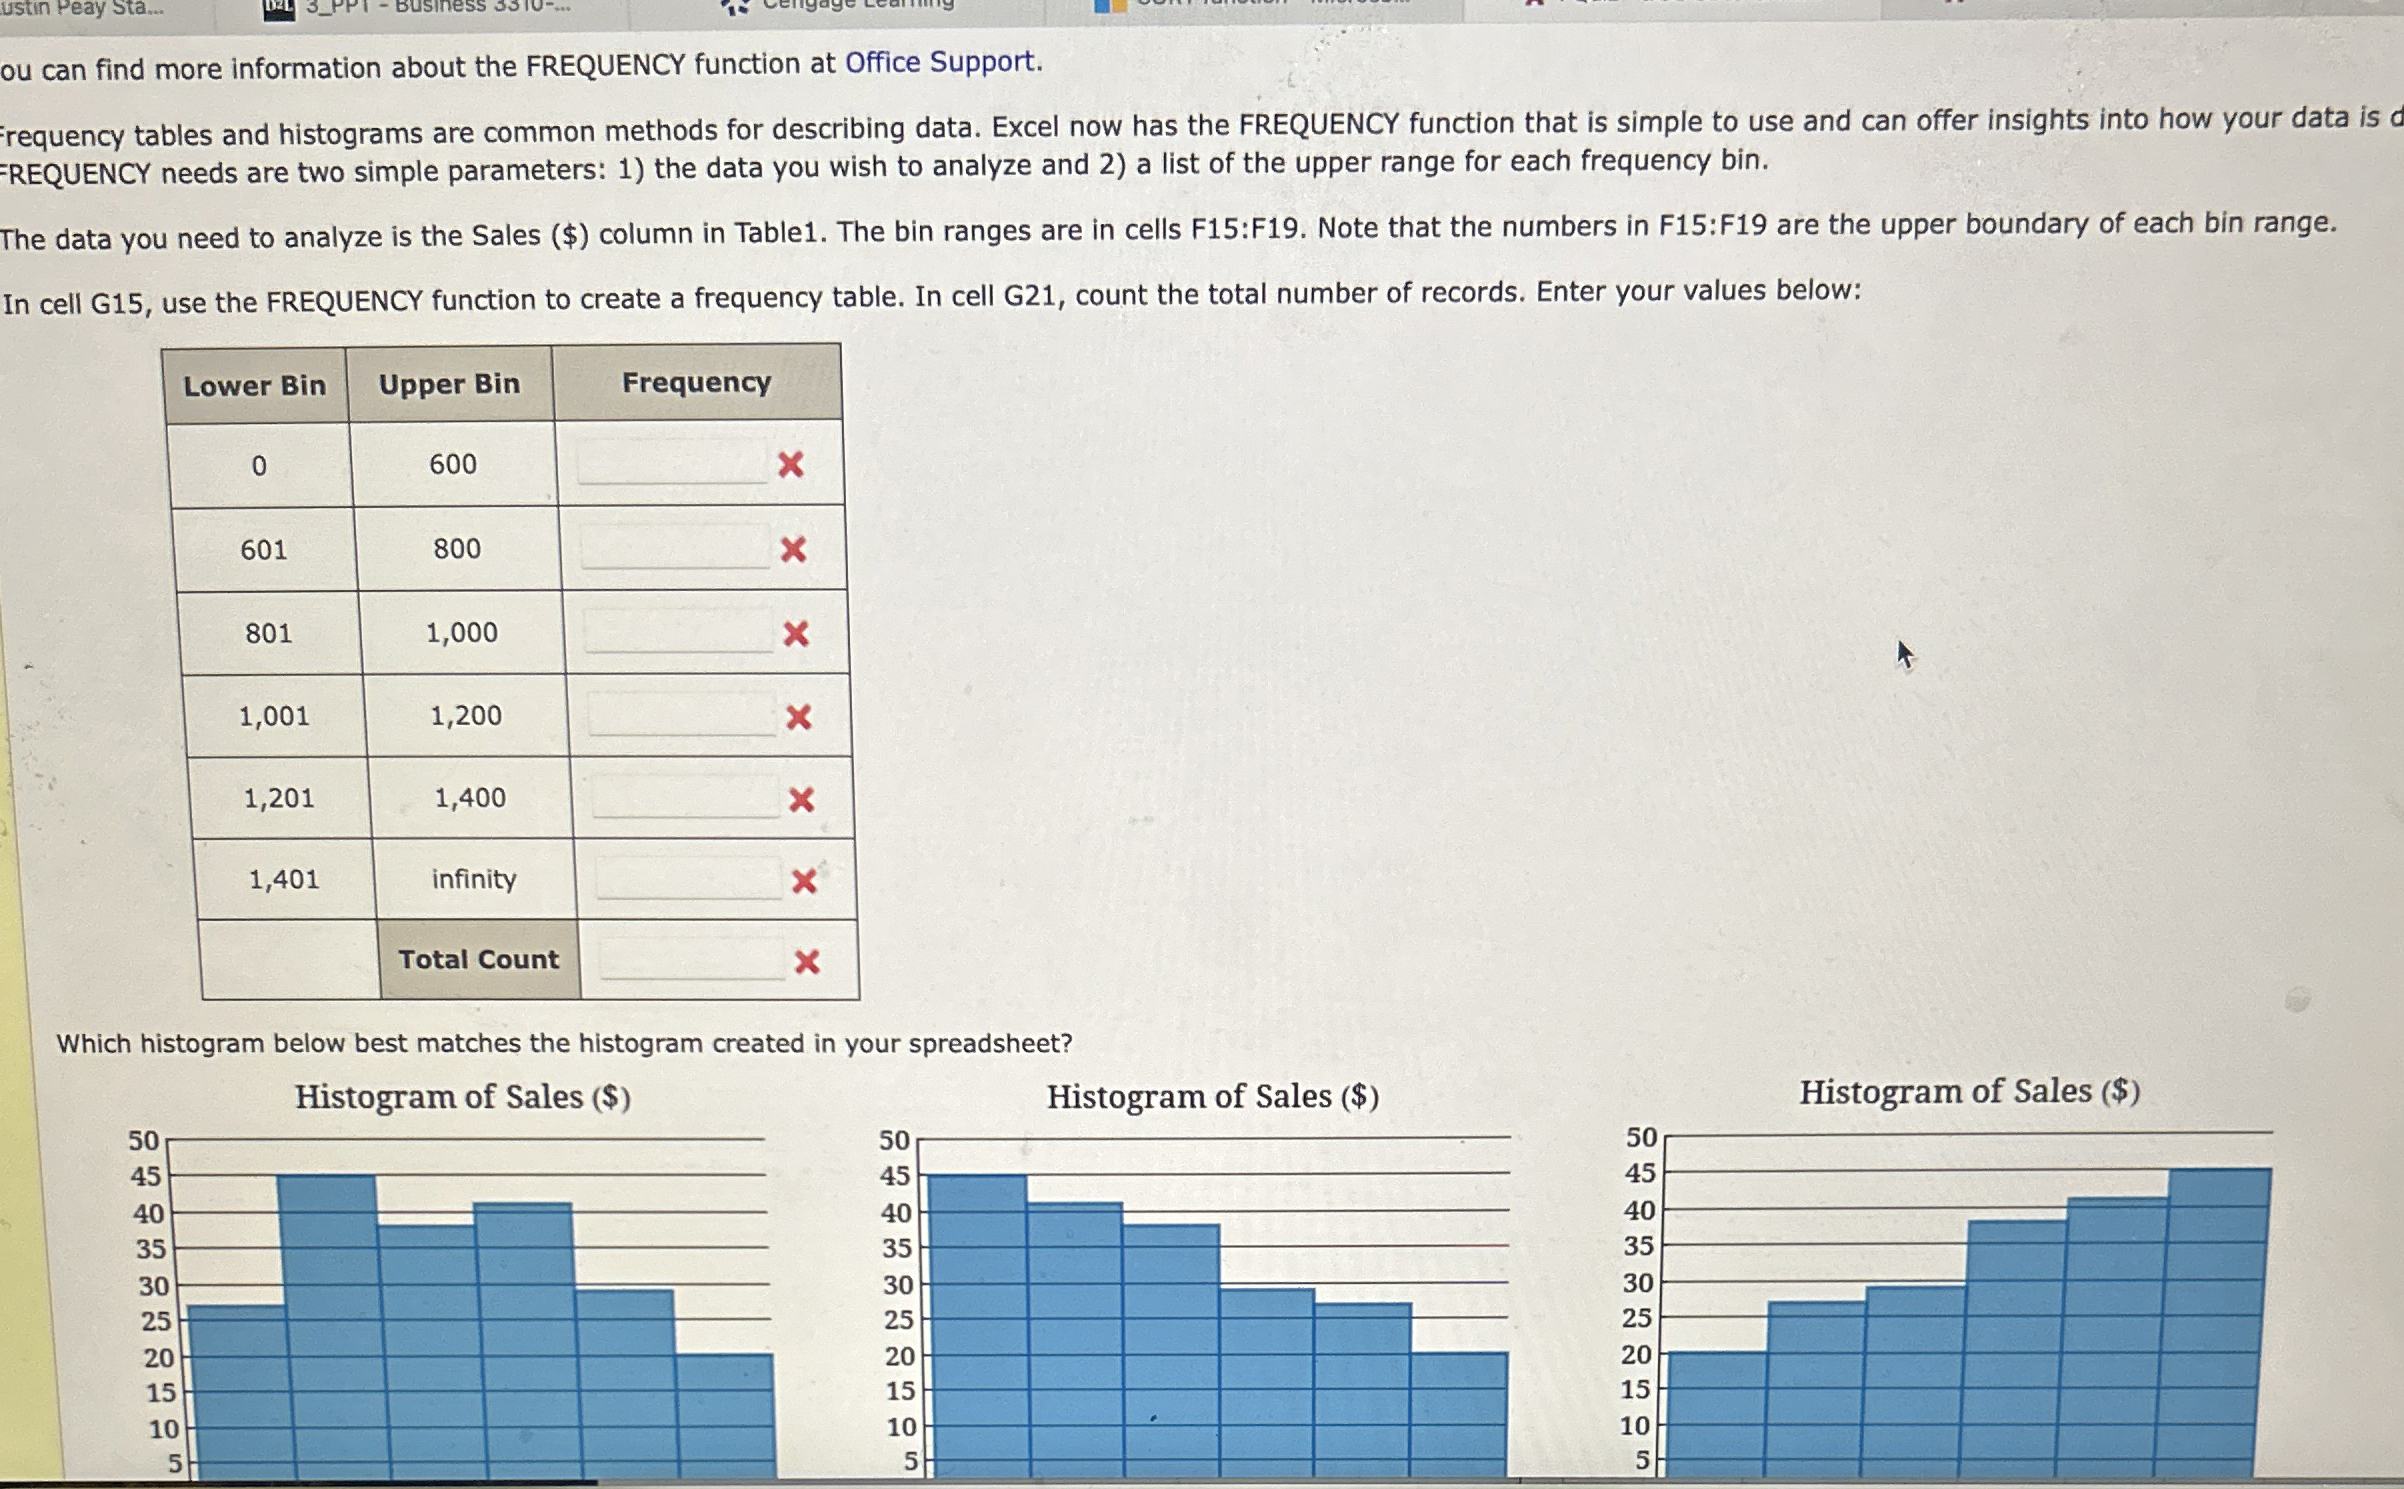
requency tables and histograms are common methods for describing data. Excel now has the FREQUENCY function that is simple to use and can offer insights into how your data is EREQUENCY needs are two simple parameters: the data you wish to analyze and a list of the upper range for each frequency bin.
The data you need to analyze is the Sales $ column in Table The bin ranges are in cells F:F Note that the numbers in F:F are the upper boundary of each bin range.
In cell G use the FREQUENCY function to create a frequency table. In cell G count the total number of records. Enter your values below:
tableLower Bin,Upper Bin,Frequency
Step by Step Solution
There are 3 Steps involved in it
1 Expert Approved Answer
Step: 1 Unlock

Question Has Been Solved by an Expert!
Get step-by-step solutions from verified subject matter experts
Step: 2 Unlock
Step: 3 Unlock