

Question: Outcome 1 2 3 4 5 6 7 8 Frequency 12 45 2 46 55 20 4 16 The table above shows the frequency of
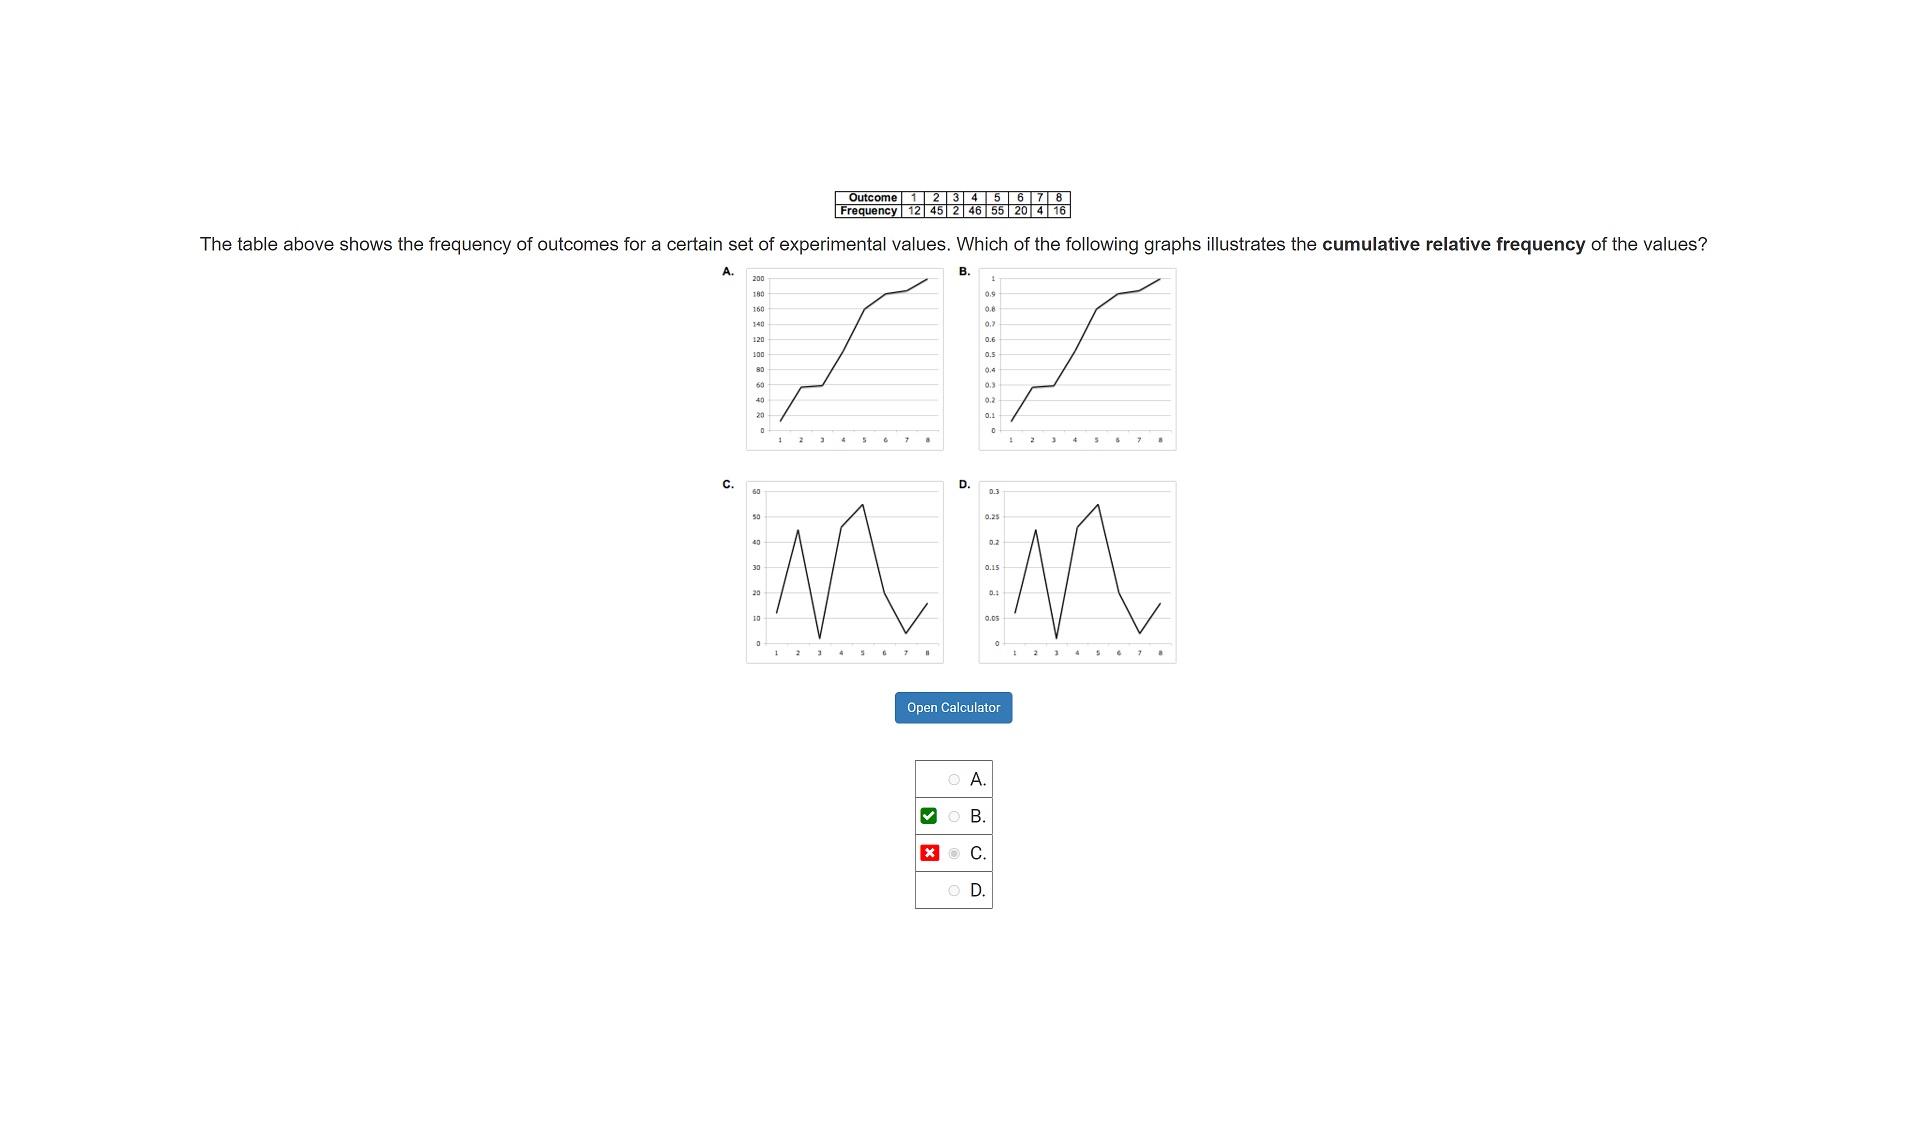

Outcome 1 2 3 4 5 6 7 8 Frequency 12 45 2 46 55 20 4 16 The table above shows the frequency of outcomes for a certain set of experimental values. Which of the following graphs illustrates the cumulative relative frequency of the values? C. 0.3 0.25 0.05 M Open Calculator O A VOB x O C. O D
Step by Step Solution
There are 3 Steps involved in it
1 Expert Approved Answer
Step: 1 Unlock

Question Has Been Solved by an Expert!
Get step-by-step solutions from verified subject matter experts
Step: 2 Unlock
Step: 3 Unlock