

Question: Can you guys please help me with the part C and if possible the next parts left ? Somehow seems like I can't figure those
Can you guys please help me with the "part C" and if possible the next parts left ? Somehow seems like I can't figure those numbers right.
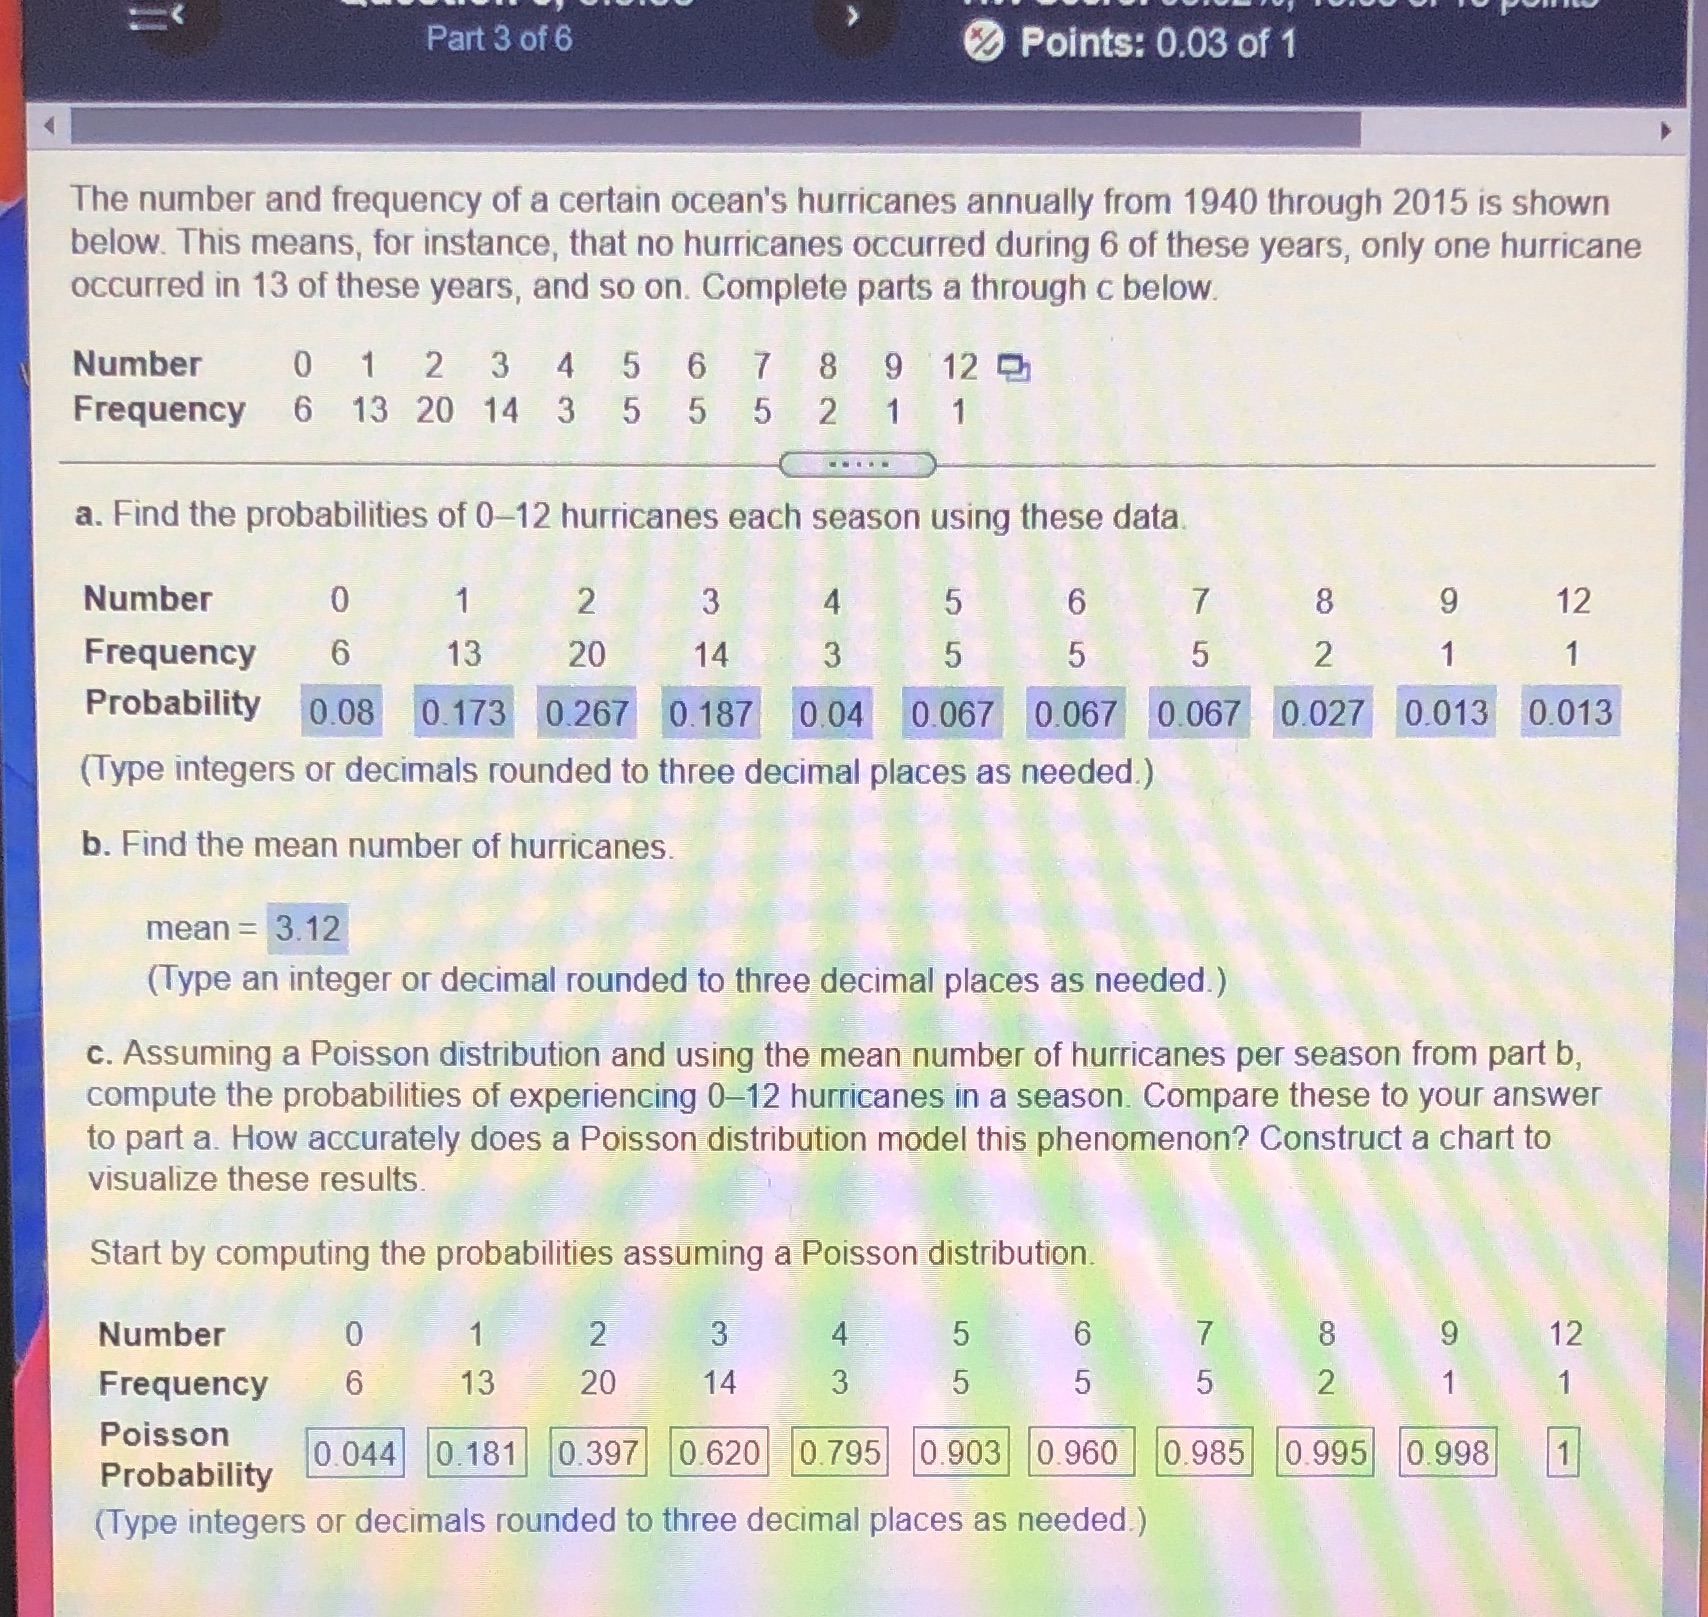
Part 3 of 6 Points: 0.03 of 1 The number and frequency of a certain ocean's hurricanes annually from 1940 through 2015 is shown below. This means, for instance, that no hurricanes occurred during 6 of these years, only one hurricane occurred in 13 of these years, and so on. Complete parts a through c below. Number 0 1 2 3 4 5 6 7 8 9 12 0 Frequency 6 13 20 14 3 5 5 5 2 1 a. Find the probabilities of 0-12 hurricanes each season using these data Number CO N O 3 12 Frequency 13 20 14 5 NO Probability 0.08 0.173 0.267 0.187 0.04 0.067 0.067 0.067 0.027 0.013 0.013 (Type integers or decimals rounded to three decimal places as needed.) b. Find the mean number of hurricanes. mean = 3.12 (Type an integer or decimal rounded to three decimal places as needed.) c. Assuming a Poisson distribution and using the mean number of hurricanes per season from part b, compute the probabilities of experiencing 0-12 hurricanes in a season. Compare these to your answer to part a. How accurately does a Poisson distribution model this phenomenon? Construct a chart to visualize these results. Start by computing the probabilities assuming a Poisson distribution. Number CO N O 6 12 Frequency 13 20 14 5 N. Poisson 0.044 0. 181 0.397 0.620 0.795 0.903 0.960 0.985 0.995 0.998 1 Probability (Type integers or decimals rounded to three decimal places as needed.)
Step by Step Solution
There are 3 Steps involved in it

Get step-by-step solutions from verified subject matter experts